
A KPI earns its place on an accountant's dashboard only when it connects a number to a decision. A margin percentage should tell a partner whether to reprice a service. A collections ratio should trigger action on overdue invoices. A retention measure should influence onboarding, service design, and investment in client relationships.
The operational cost of weak measurement can hide inside everyday software use. A 2026 accountant technology survey found that the average firm uses 10 apps or software programs, while accountants report losing about 5 hours each week moving, re-entering, or reconciling information between tools. For a 40-hour week, that represents 12.5% of staff time, calculated from the survey's figures, that can't be used for review work, client service, or advisory capacity. The same survey found that only 41% of firms considered their tools fully integrated, while 48% described their stack as functional but fragmented. The survey findings make a strong case for consistent data access, not merely more reporting.
This guide presents eight key performance indicators for accountants across profitability, working capital, customer economics, retention, and asset efficiency. Each one includes a definition, formula, purpose, reporting cadence, data sources, dashboard use, limitations, and a practical implementation step. Accountants can also compare these measures with the wider context in Wisely's accounting services.
Cloudvara fits naturally into that workflow by centralizing accounting, tax, CRM, document-management, and Microsoft applications on a cloud platform that teams can access from different locations. The result isn't a substitute for sound accounting judgment. It's a way to give the people making decisions more consistent access to the records behind the dashboard.
Gross profit margin shows how much revenue remains after the direct costs of delivering a product or service. It separates the economics of the service itself from overheads such as administration, sales, rent, and general management.
Formula:(Revenue - Cost of Goods Sold) / Revenue × 100
For an accounting firm, COGS might include delivery costs directly associated with a service line, depending on the firm's cost-allocation policy. For a cloud hosting provider, direct costs may include infrastructure, hosting capacity, and other costs that rise with service delivery. The classification must be documented, because moving a cost between COGS and operating expenses can change the ratio without changing the underlying economics.
Gross margin is most useful as a trend and service-line measure. Review it monthly, compare it with the prior period, and split it by tax, audit, advisory, hosting, or other meaningful offerings. A firm might discover that a high-revenue service consumes disproportionate senior review time, while a smaller recurring service produces more contribution after direct delivery costs.
Practical rule: Never interpret margin without checking what the business has classified as a direct cost.
The KPI supports decisions about pricing, staffing, scope, and technology. If margin falls while revenue remains stable, investigate delivery hours, subcontractor costs, infrastructure usage, discounts, and unbilled work. If a cloud migration changes the cost structure, the accountant should compare the client's direct service costs before and after migration rather than relying only on total IT spend.
IFAC's practice-management guidance identifies gross margin and net profit among foundational profit-and-loss KPIs, alongside balance-sheet measures such as lock-up days. Its framework places profitability beside cash conversion and operating efficiency, which is a useful reminder that margin isn't the same as cash in the bank. IFAC's KPI guidance provides the historical context for treating this as a practice-management measure, not just a financial-statement ratio.

Start by agreeing on the COGS policy, assigning an owner to each cost category, and building a monthly margin view by service line. A centralized environment can make that review more repeatable. Guidance on cutting business costs can support the operational discussion, but the KPI should always be calculated from the firm's own approved accounts.
The operating expense ratio, or OER, measures the share of revenue consumed by operating expenses after direct delivery costs have been excluded. It answers a different question from gross margin. Gross margin asks whether the service is economically viable to deliver. OER asks how much of the remaining revenue is required to run the business.
Formula:Operating Expenses / Revenue × 100
Include expenses such as administration, technology, premises, sales, marketing, and management according to the firm's accounting policy. Exclude COGS if the purpose is to assess overhead efficiency after direct service costs. If the policy changes, preserve the old definition long enough to explain any break in the trend.
Accountants should review OER monthly for internal control and quarterly for structural decisions. The dashboard should show total OER alongside revenue growth, headcount, technology spending, and operating profit. A falling ratio can indicate scale, but it can also reflect underinvestment in training, support, compliance, or systems. A low number isn't automatically healthy if service quality and control standards are deteriorating.
Consider an accounting practice that adds recurring advisory work but continues to handle billing, document requests, and client reminders manually. Revenue may grow, yet operating expenses can rise at the same pace. OER exposes that lack of operational efficiency. A separate view by category then shows whether the pressure comes from payroll, software, facilities, marketing, or external support.
The ratio also helps compare budget with actual performance. Set a budget for each operating category, investigate material variances, and record whether the cause is temporary or structural. Don't respond to every increase with a blanket cost reduction. Some expenses create capacity or protect quality, and cutting them may increase write-offs or client churn later.
A fragmented application stack can make OER analysis harder because software expenses may be distributed across departments and duplicate functions. Workflow-efficiency guidance can help teams examine whether automation and centralized access reduce manual administration. The accounting treatment still belongs in the firm's ledger, while the workflow analysis explains why the costs exist.
Use OER as a decision signal, not a universal target. First define the expense boundary, then assign a finance owner, publish the reporting date, and add a variance note to every monthly review. The most useful dashboard doesn't merely display that OER changed. It identifies which expense moved, who owns it, and what action follows.
The cash conversion cycle, or CCC, tracks the time between paying for inputs and collecting cash from customers. It links the income statement to working capital. A profitable business can still experience pressure if it pays suppliers or staff long before customers settle invoices.
Formula:Days Inventory Outstanding + Days Sales Outstanding - Days Payable Outstanding
A service firm may have little or no traditional inventory, but it can still have working capital tied up in work in progress, unbilled time, receivables, prepaid services, and supplier commitments. For that reason, accountants should adapt the components to the firm's operating model rather than force a retail-style interpretation onto a professional practice.
Review CCC monthly, with a weekly exception view for overdue receivables and large unbilled balances. Use the general ledger, billing system, aged receivables, supplier ledger, time records, and work-in-progress report as source systems. A centralized reporting environment reduces the risk that each department uses a different date, balance, or revenue definition.
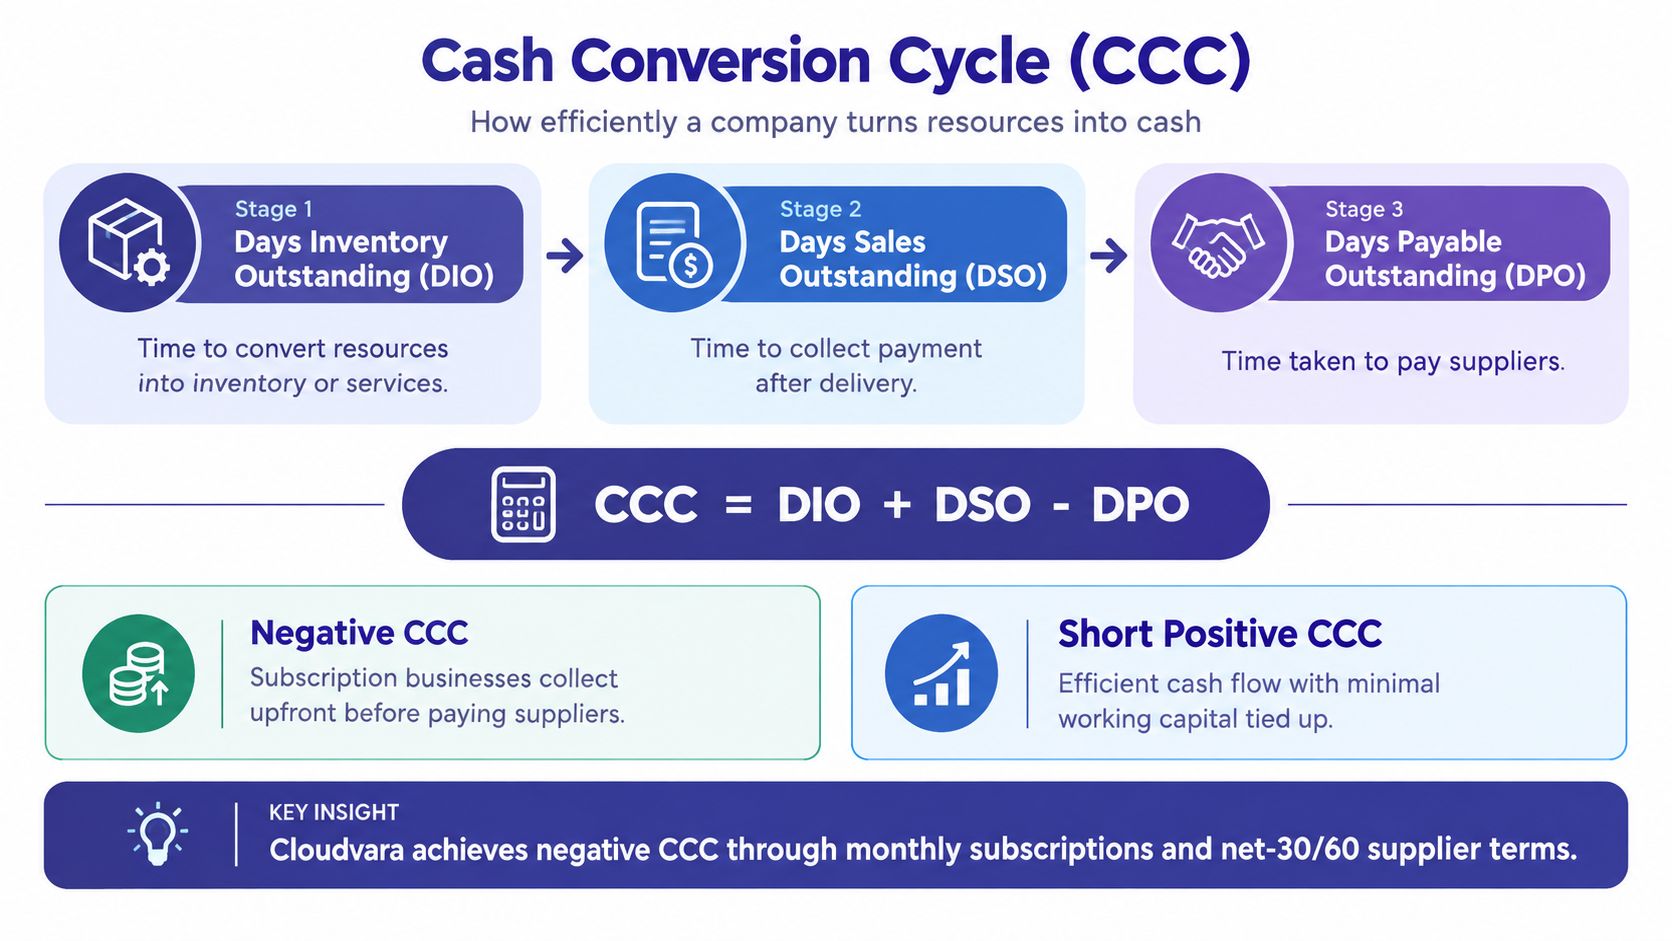
A longer CCC can result from slow billing, weak collections, excessive work in progress, short supplier terms, or a mismatch between delivery and invoicing. The remedy depends on the component. Faster invoice approval helps DSO, while better scope control helps prevent unbilled work from accumulating. Negotiating supplier terms may improve DPO, but delaying payment beyond agreed terms can damage relationships and credit standing.
Subscription billing may shorten the cycle when customers pay before the service period, but billing frequency must still fit customer expectations and contractual terms. For an accounting firm, moving from irregular billing to a clear recurring arrangement can make cash receipts more predictable, provided the service scope and cancellation terms are transparent.
This cash conversion cycle explainer is useful background for the contrarian point that cash discipline deserves equal attention to utilization and revenue. The practical action is simple: calculate each component separately, assign an owner to every delay, and discuss the largest movement at the monthly operating review.
Customer acquisition cost, or CAC, measures the sales and marketing cost required to win a new customer. Accountants should calculate it for the whole business and, where the data supports it, by channel, segment, service line, and customer type.
Formula:Total Sales and Marketing Expenses / Number of New Customers Acquired
Define the cost boundary before calculating. Decide whether the numerator includes salaries, commissions, agency fees, advertising, events, software, content production, and allocated management time. Use the same boundary every period. Otherwise, a fall in CAC may merely reflect omitted costs.
CAC belongs in a monthly commercial dashboard, but the underlying customer cohorts need time to mature. A campaign that produces many initial customers may still be uneconomic if those customers require extensive onboarding, discounting, or support. Pair CAC with retention, customer lifetime value, gross margin, and payback analysis.
An accounting firm might compare referrals, partnerships, search, events, and direct outreach. A referral channel can appear inexpensive because existing relationship costs are not allocated to it. That doesn't make the channel bad, but it means the firm should distinguish cash campaign cost from fully loaded acquisition cost.
The same logic applies to a free trial or consultation. A low-friction offer can improve qualification, but it also creates staff work. Record the effort required to convert and onboard customers, not just the advertising invoice. For Cloudvara users, centralizing CRM records with accounting and service data can help connect campaign source to contract value and ongoing support requirements.
CAC is a decision metric, not a badge for the marketing team. If it rises, don't immediately cut the channel. Check whether the firm has changed its target segment, pricing, sales cycle, or definition of a new customer. Then test one controlled change and document the result.
For firms considering a new practice, this guide to starting a CPA firm provides relevant operating context. The implementation step is to appoint one owner for the numerator, one owner for customer counts, and one reviewer responsible for checking whether the acquired work is profitable after delivery costs.
Customer lifetime value, or LTV or CLV, estimates the economic value of a customer relationship across its expected duration. It prevents accountants from judging acquisition decisions solely by first-period revenue.
A basic contribution-based formula is:
Average Customer Revenue per Year × Expected Customer Lifespan in Years - CAC
For stronger analysis, replace revenue with contribution margin when direct service costs are available. Segment the calculation by customer type because a small business, nonprofit, tax client, and advisory client may have different prices, support needs, expansion potential, and retention patterns.
LTV should be reviewed monthly for trend changes and quarterly for planning. Use billing records, contract data, customer status, service costs, expansion revenue, and CAC. Don't calculate one blended number and apply it to every segment. A blended LTV can hide a group that pays well but consumes excessive senior time.
A customer who renews and expands can justify a different acquisition investment from one who leaves after an onboarding-heavy period. That makes LTV useful for decisions about service design, support coverage, pricing, and cross-selling. It also gives partners a way to evaluate whether a discount attracts a valuable relationship or merely reduces first-period revenue.
For example, an accounting firm might find that clients using bookkeeping, tax, and advisory services remain more valuable than clients buying one isolated filing service. That doesn't prove that every client should be cross-sold. It does show why service penetration and client needs deserve a place beside revenue in the analysis.
Research cited in Xero's accounting-firm guidance states that acquiring a new client typically costs five to 25 times more than retaining an existing one. The number is a reason to examine retention economics closely, not a justification for keeping every client at any price. An unprofitable relationship can still need repricing, scope control, or a managed exit.
Use LTV to set commercial priorities, but show the assumptions beside the result. Record the retention definition, lifespan method, margin treatment, and CAC period. For a broader perspective on the metric, accountants can also review valore cliente nel tempo. The implementation action is to create separate LTV views for each material customer segment and review the assumptions whenever service or pricing changes.

The accounts receivable turnover ratio measures how efficiently a business converts credit sales into collections. It complements the cash conversion cycle by focusing specifically on the receivables process.
Formula:Net Credit Sales / Average Accounts Receivable
Use net credit sales consistently and calculate average receivables from the opening and closing balances, or from a more frequent average when balances fluctuate significantly. The source data normally comes from the sales ledger, general ledger, credit notes, receipts, and aged receivables report.
Review the ratio monthly, but don't rely on it alone. A higher turnover can indicate faster collection, yet it may also result from a temporary reduction in credit sales or unusually low receivables at the reporting date. Pair it with days sales outstanding, aged debt, disputed invoices, bad-debt provisions, and customer concentration.
A professional practice may issue accurate invoices but collect slowly because approvals are unclear, invoices lack supporting detail, or clients receive them at the wrong address. Another practice may collect quickly overall while carrying one large overdue balance that the blended ratio conceals. Segment receivables by client, service, age, partner, and dispute status.
Online payment options, automated reminders, recurring billing, and clear engagement terms can shorten the path from invoice to cash. Automation doesn't replace judgment. A reminder sent to a client disputing scope may worsen the relationship unless a person reviews the account first.
Centralized document access helps here because staff can retrieve engagement letters, invoice support, correspondence, and payment records without searching disconnected systems. Cloudvara's document-management software for accountants is one example of the type of system accountants may evaluate when designing that workflow.
The practical action is to add an aged-receivables exception panel to the monthly dashboard. Show the balance, age, responsible relationship owner, dispute status, and next action. The ratio tells you whether collection performance is changing. The exception list tells someone what to do about it.
Churn rate measures the share of customers who cancel or stop using a service during a defined period. It is particularly important for firms with recurring tax, bookkeeping, advisory, software, hosting, or managed-service revenue.
Formula:Customers Lost During the Period / Customers at the Start of the Period × 100
Define “lost” precisely. A customer that pauses service may not be churned. A customer that reduces scope may represent revenue churn without logo churn. A client transferred between service lines may be retained by the firm even though one team loses the account. The dashboard should distinguish customer churn from revenue churn where the business model requires it.
Review churn monthly and study cohorts quarterly. Source the customer count from the CRM or practice-management system, then reconcile it with contracts, billing status, cancellations, and service records. Track new-customer churn separately from established-customer churn. Early losses often point to sales qualification, onboarding, expectation setting, or implementation problems.
Exit feedback should classify causes such as price, service quality, response time, technology friction, business closure, acquisition, or a change in client needs. Don't assume every departure is preventable. The value of the KPI comes from identifying patterns that the firm can influence.
Churn also connects directly to customer economics. A modest change in retention can alter the resources available for acquisition and service improvement. That is why retention belongs beside CAC and LTV rather than in a separate customer-success report.
Software usability can affect this picture. A qualitative study of accountant-facing applications reported overall user satisfaction of 5.75 out of 10, with user-friendliness at 6.25 and feature availability at 5.5. A separate summary from the same source described overall satisfaction as 7.6 out of 10, with value for cost ranking highest and customer support lowest. The study presents mixed measures, so teams should verify the definitions before comparing them. The practical lesson is clear: monitor support responsiveness, task completion, adoption, and workflow friction alongside financial retention.
Assign an owner to every churned account, document the reason, and review recurring causes at the quarterly operating meeting. A retention dashboard that only displays the percentage lost is incomplete. It should also show who left, why, what revenue or capacity was affected, and which process will change.
Return on assets, or ROA, measures how effectively a business uses its asset base to generate profit.
Formula:Net Income / Total Assets × 100
Use average total assets when that better reflects the period's asset base, especially when major purchases or disposals occur during the year. Document whether net income is measured before or after particular items, and apply the same policy when comparing periods.
ROA is most useful for businesses with meaningful technology, infrastructure, equipment, or property investments. For a cloud service provider, the asset base may include servers, networking equipment, storage, and other infrastructure. For an accounting firm, the relevant assets may be less physical, but the ratio can still support decisions about technology investments, premises, and acquired operations.
Review ROA quarterly rather than reacting to every monthly movement. Net income can fluctuate because of timing, provisions, depreciation, or one-off costs. Break the analysis into asset categories and compare asset growth with the profit generated after the investment is deployed.
An asset-light model may produce a higher ROA because the denominator is smaller, but that doesn't automatically mean it delivers better service or lower risk. Leasing equipment, using third-party infrastructure, or outsourcing a function changes the cost structure and control environment. The accountant should compare total economic cost, reliability, capacity, security, and contractual exposure, not only the ratio.
A new technology investment should have a recorded business case. Define the expected operational effect, the responsible owner, the implementation date, and the review period. Then compare actual profit and capacity with the approved assumptions. If the asset supports several services, allocate its use transparently rather than assigning the full cost to whichever team purchased it.
Cloud access can make asset and service data easier to review across locations, but it doesn't eliminate the need for asset registers, depreciation policies, or impairment testing. The implementation action is to create a quarterly asset-return review that links each major asset category to revenue, direct cost, operating profit, utilization, and strategic purpose.
| KPI | Implementation complexity | Resource requirements | Expected outcomes | Ideal use cases | Key advantages |
|---|---|---|---|---|---|
| Gross Profit Margin | Low, basic calculation from revenue and COGS | Revenue and COGS data from accounting | Service-level profitability insight | Pricing strategy, service cost optimization | Simple, comparable, highlights pricing power |
| Operating Expense Ratio (OER) | Low–Medium, requires OPEX segmentation | Detailed operating expense reporting | Visibility into operating efficiency and scalability | Overhead control, budget planning, scaling analysis | Reveals discretionary spend and cost-cutting opportunities |
| Cash Conversion Cycle (CCC) | Medium, combines DIO, DSO, DPO | Receivables, payables, inventory/billing data | Working capital and cash flow timing | Cash management, vendor terms negotiation, billing cadence | Shows cash flow timing; can highlight negative CCC in subscriptions |
| Customer Acquisition Cost (CAC) | Medium, needs attribution and channel tracking | Sales & marketing spend and new customer counts | Marketing efficiency and payback period | Channel optimization, marketing budget allocation | Direct ROI metric for acquisition, enables channel comparison |
| Customer Lifetime Value (LTV / CLV) | Medium–High, requires retention and revenue forecasting | Customer revenue history, churn/retention metrics | Long-term profitability and allowable acquisition spend | Pricing strategy, retention investment, segmentation | Quantifies customer value; guides LTV/CAC decisions |
| Accounts Receivable Turnover Ratio | Low, simple ratio from sales and AR | Net credit sales and average accounts receivable | Collection speed and DSO estimation | Collections improvement, billing automation adoption | Direct indicator of collection efficiency and cash flow impact |
| Churn Rate | Low, straightforward customer or revenue attrition metric | Subscription/customer status tracking | Retention health and impact on growth/LTV | Onboarding, customer success, product-market fit analysis | Most direct indicator of customer retention and satisfaction |
| Return on Assets (ROA) | Low, uses net income and asset base | Financial statements, asset valuation | Asset utilization and return on infrastructure investment | Capex decisions, infrastructure optimization, benchmarking | Shows efficiency of asset deployment; useful for capital-heavy firms |
Eight metrics can provide a strong starting dashboard, but the dashboard only becomes useful when each number has a decision attached to it. Gross profit margin and OER support pricing and cost choices. CCC and receivables turnover expose cash pressure. CAC and LTV connect commercial investment with customer economics. Churn reveals whether recurring revenue is stable. ROA tests whether the business is converting investment into profit.
Start with a small set that reflects the firm's operating model. A compliance-focused practice may need close attention to realization, work in progress, collections, and client profitability in addition to the metrics above. An advisory-led firm may place more weight on response time, service penetration, recurring revenue, and retention. Public guidance often presents utilization as a universal benchmark, but the right mix changes when teams move from hourly compliance work to advisory or managed services.
Define every KPI before publishing it. Write down the formula, included and excluded accounts, period, reporting date, data owner, reviewer, and acceptable comparison. A metric isn't consistent if one manager uses booked revenue while another uses collected revenue. It isn't actionable if nobody knows who investigates the variance.
Then document the source systems. Record whether the number comes from the general ledger, CRM, billing platform, time records, aged receivables, contract register, asset register, or a reconciled data warehouse. If the firm uses multiple applications, establish a common customer identifier and a clear process for resolving mismatches. The 2026 technology survey found that 92% of firms had invested in technology during the prior 12 months, with average investment of about $21,000, and 91% planned to invest again with an expected average of $22,000. Those survey results show why integration should be treated as a budget and performance question, not merely an IT preference.
Use segment and period comparisons. Review service line, customer group, partner, location, acquisition channel, and cohort where the data is reliable. Compare the current period with the prior period, budget, and an approved internal target. External benchmarks can offer context, but they shouldn't override the firm's accounting policies, pricing model, staffing structure, or service mix.
A practical rhythm is a monthly operating review covering profitability, cash, acquisition, retention, and collections. Hold a deeper quarterly review for operating efficiency, customer economics, asset returns, assumptions, and policy changes. Review exceptions rather than merely recording figures. A dashboard should make it easy to answer, “What changed, why did it change, who owns the response, and when will we check again?”
Centralized application access can reduce repetitive data handling when accounting, tax, CRM, document management, and Microsoft applications share a consistent working environment. Cloudvara can be one relevant option for teams that need remote access to existing applications, documented backups, and a common place to work with reporting data. The platform doesn't make a KPI accurate by itself. Teams still need reconciliations, access controls, clear definitions, and disciplined review.
Before acting on a target, validate the benchmark fit and data quality. Check whether revenue is recognized consistently, whether direct costs are classified correctly, whether customer counts reconcile with billing, and whether asset values reflect the applicable accounting policy. Then choose the first action, assign its owner, and record the expected operational result. A focused KPI rhythm, supported by the principles in this high performing KPI strategy guide, gives accountants something more valuable than a full dashboard. It gives them a repeatable way to turn accounting data into decisions.
Cloudvara centralizes accounting, tax, CRM, document-management, and Microsoft applications on a cloud platform accessible from different locations, helping accounting teams work from more consistent operational data. Visit Cloudvara to explore how centralized application access can support recurring KPI reporting, collaboration, and day-to-day accounting workflows.