When you're trying to boost application performance, you can't just rely on guesswork. Flying blind is a surefire way to waste time chasing ghosts. The real starting point is to establish a clear performance baseline by tracking key metrics before you touch a single line of code. This snapshot becomes your ground truth—the objective data you need to pinpoint real bottlenecks and actually measure if your fixes are working.
Relying on intuition to fix performance issues is a classic engineering mistake. I've seen teams spend weeks optimizing a function they thought was slow, only to find the real problem was an inefficient database query or a sluggish third-party API call. Without data, you're just guessing, and that can introduce new problems while leaving the original one unsolved.
This is where Application Performance Management (APM) tools become your best friend. They give you the objective data you need by tracking what your application is doing in real-time. Instead of speculating, you get a clear, evidence-based picture of your system's health.
So, your first real step is to set up monitoring to create that performance baseline. This isn’t about drowning in data; it's about focusing on the metrics that directly impact what your users feel.
Here are the essentials to track:
Once you have this data, performance tuning stops being a guessing game and becomes a methodical, data-driven process. The workflow is simple but incredibly powerful.
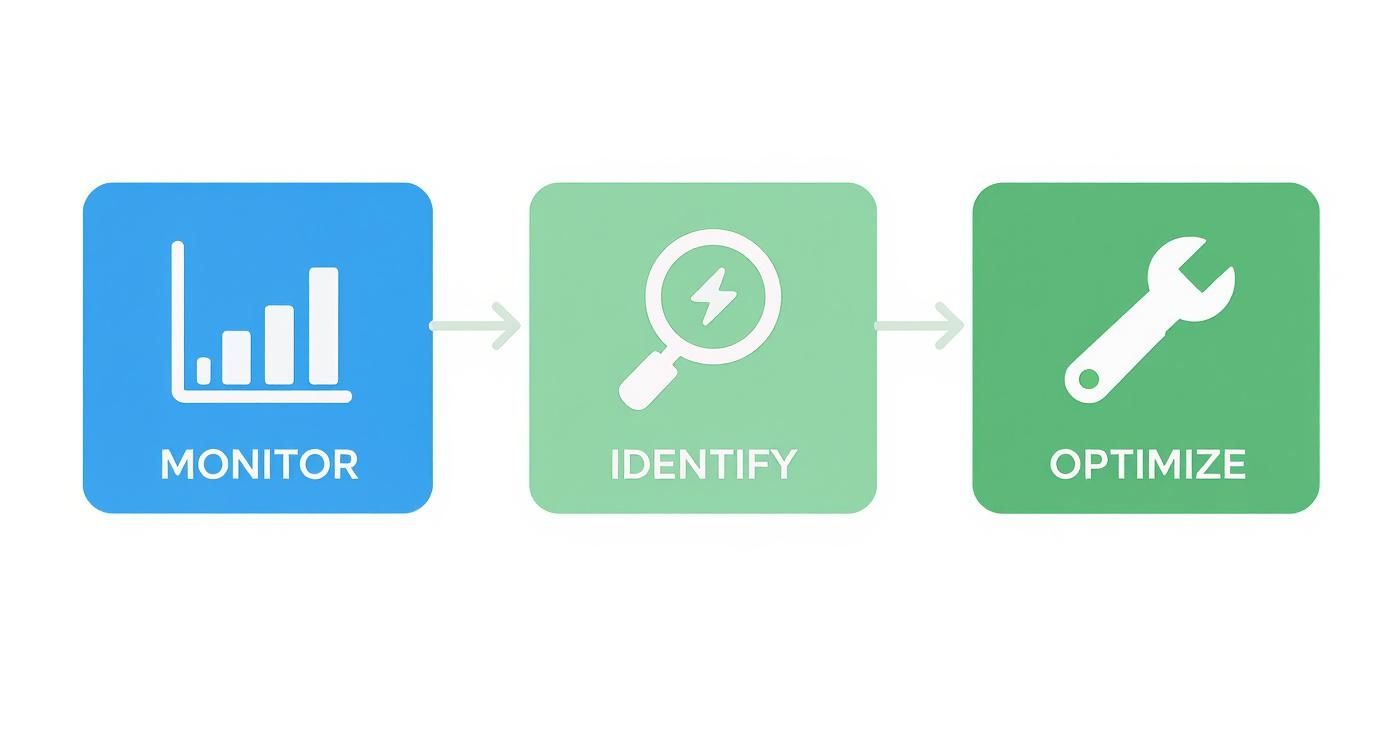
You monitor to gather the data, use that data to find the specific bottlenecks, and then apply targeted fixes. Simple as that.
As our systems get more complex and distributed, solid monitoring is more critical than ever. It's no surprise that the global Application Performance Management market is expected to jump from USD 7.30 billion in 2024 to USD 28.36 billion by 2035. That massive growth just proves what every experienced engineer knows: you can't manage what you don't measure.
A baseline is more than just a set of numbers; it's your single source of truth. Every optimization you implement should be validated against this baseline to prove its effectiveness. Without it, you're flying blind.
Understanding your application's current state is a foundational step, much like a business technology assessment identifies strengths and weaknesses before mapping out a strategy. To get beyond speculation and build an effective performance strategy, you need a systematic approach like the one detailed in this guide on How to Optimize Website Performance: A Sitecore & SharePoint Guide.

With a performance baseline in hand, you can stop just watching and start investigating. The next move is to dig deeper than surface-level metrics to find the exact lines of code, database queries, or API calls causing slowdowns. This is where you bring in the heavy hitters: profiling and distributed tracing.
Think of profiling tools as a microscope for your code. They attach to your running application and measure exactly how much time and memory each function call eats up. Instead of guessing which part of your logic is the culprit, a profiler shows you precisely where the application is spending its time. You might discover, for example, that a seemingly innocent data transformation function is actually responsible for 80% of the CPU usage on a high-traffic endpoint.
This level of detail is a complete game-changer. Without it, you’re just making educated guesses, which often sends you down the wrong rabbit hole. A profiler gives you the hard evidence needed to focus your optimization efforts where they’ll actually make a difference.
In modern microservices architectures, a single user request can set off a complex chain reaction, hopping between multiple services before it ever returns a response. A delay in any single one of those services can slow the entire process down. This is where distributed tracing becomes absolutely essential.
Distributed tracing follows a single request on its journey through your entire system. It assigns a unique ID to the request and tracks it as it moves from one service to another, measuring the time spent at each stop along the way.
This creates a visual timeline of the request's entire lifecycle, allowing you to spot bottlenecks that would otherwise be invisible. You might find that your user service responds in a snappy 20ms, but the downstream authentication service it calls takes a sluggish 400ms. Without tracing, you'd only see the combined slow response and might mistakenly blame the user service.
By visualizing the entire request path, distributed tracing turns a complex, distributed system into a clear, understandable story. It helps you pinpoint not just which service is slow, but why it's waiting.
One of the most common—and damaging—performance issues that profilers and tracers uncover is the N+1 query problem. This sneaky issue happens when your code fetches a list of items (the "1" query) and then loops through that list to execute a separate database query for each individual item (the "N" queries).
It’s a classic performance killer.
Tools like profilers can flag these patterns almost immediately by showing a massive number of identical-looking SQL queries being executed for a single request. Finding and fixing an N+1 issue, usually by refactoring your code to fetch all the necessary data in a single, optimized query, can often produce a 10x or even 100x performance improvement.
This kind of deep-dive analysis is a critical part of any real performance strategy. While high-level monitoring tells you there's a fire, tools like profilers and tracers hand you the extinguisher and point you to the exact source of the smoke. It mirrors the core idea behind understanding what is network monitoring, where visibility into specific traffic patterns is the key to identifying and resolving issues.

After you’ve pinpointed your code-level bottlenecks, you’ll often find a common culprit: the slowest operations are the ones fetching the same data over and over. This is where caching stops being a nice-to-have and becomes a critical tool for improving application performance. A well-thought-out caching strategy can dramatically reduce your database load and slash latency.
Think of caching as your application's short-term memory. Instead of making a costly trip to the database for every single request, your app checks its cache first. If the data is there, it’s served up almost instantly, creating a much snappier experience for the user.
The secret to effective caching is picking the right tool for the job. Each type of cache serves a different purpose, and using the wrong one can add more complexity than it solves. It’s important to understand your options.
The golden rule of caching is simple: store data that is frequently read but rarely changed. If you cache the wrong things, like rapidly updating user-specific info, you risk serving stale content. And nothing frustrates a user more than seeing outdated information.
Good candidates for caching often include:
The real goal of caching isn't just speed; it's about being smart. By selectively caching high-impact data, you free up your primary database to focus on what it does best: handling essential write operations and complex queries that can’t be cached.
Finally, you need a solid plan for cache invalidation—the process of clearing out or updating stale data. A common strategy is setting a Time-to-Live (TTL), which makes data automatically expire after a set period. Another method is event-based invalidation, where the cache is actively cleared anytime the source data changes. The growing complexity of these systems is a key reason the Application Performance Monitoring market is projected to hit $2,588.5 million by 2025. You can find more details on this trend and its drivers by reading the full research on application performance monitoring software.
Deciding which caching strategy to use depends entirely on what you're trying to achieve. Here's a quick breakdown to help you match the right tool to your specific needs.
| Caching Type | Best For | Pros | Cons |
|---|---|---|---|
| In-Memory Cache | Storing frequently accessed, non-critical data within a single application instance. | Extremely fast access times with zero network latency. | Data is lost on restart; not shared across multiple servers. |
| Distributed Cache | Maintaining data consistency for applications running on multiple servers. | Shared data pool, high availability, and persistent storage options. | Adds network overhead; requires managing a separate service. |
| CDN | Delivering static assets like images, videos, and scripts to a global user base. | Reduces latency for users worldwide; significantly offloads server traffic. | Primarily for static content; not suitable for dynamic, user-specific data. |
Ultimately, many high-performance applications use a hybrid approach, combining a CDN for assets, a distributed cache for shared data, and maybe even a small in-memory cache for process-specific hot data.
When an application feels sluggish, it’s easy to blame the code. But more often than not, the real bottleneck is hiding in the database. An inefficient query or a poorly structured data model can grind everything to a halt, no matter how optimized your application logic is. Digging into your database layer is one of the fastest ways to get a major performance boost.
The first step is to play detective. Your database comes with powerful built-in tools, like query execution plan analyzers, that show you exactly how it’s fetching data. These tools are your best friends for spotting hidden problems, such as a full table scan where a simple index would do the job. I've seen a single missing index on a frequently queried column bring an entire system to its knees. Adding it can be the most impactful change you make.
Once you’ve sorted out any obvious indexing gaps, it’s time to look at the queries themselves. A badly written query can force the database to do way more work than it needs to. Sometimes, this means refactoring a complex JOIN that’s trying to do too much at once. Other times, it means breaking a monstrous query down into smaller, more focused parts that execute faster.
Another classic performance killer is making too many trips back and forth to the database. Think about an app that fetches a list of 100 products, then makes 100 separate database calls to get the details for each one. That's incredibly inefficient. This is where techniques like eager loading come into play. By fetching all the related data you need in one well-structured query, you slash network latency and lighten the load on your database.
Inefficient database access patterns create a "death by a thousand cuts" scenario. Each small, unnecessary query adds up, slowly draining performance until the entire application feels unresponsive under load.
It’s not just about the queries; how your application talks to the database is just as important. For example, opening a new database connection for every single request is a huge waste of resources. Connection pooling solves this by keeping a cache of ready-to-use connections on standby. This simple practice can shave precious milliseconds off every transaction.
Your database schema also has a massive long-term impact on performance. A well-designed, normalized schema prevents data redundancy and helps your queries stay lean and fast, even as your data grows. Taking the time to plan your data structures upfront will save you from a world of performance headaches later on. For a much deeper look at these foundational principles, our guide on database management best practices offers a comprehensive roadmap for building a solid, scalable data layer.
By systematically working through these areas—indexing, query structure, connections, and schema—you can transform your database from a performance bottleneck into a well-oiled machine that keeps your application fast and responsive.
True performance isn’t just about speed out of the gate. It’s about maintaining that speed as your audience grows. An application that’s snappy for ten users but grinds to a halt under a thousand isn't performing—it's failing. This is precisely where a scalable cloud architecture becomes your most valuable asset.
At its core, scaling means adding resources to handle more traffic. In the cloud, this boils down to two main paths: scaling up or scaling out.
Vertical Scaling (Scaling Up): This is the equivalent of giving your server a shot of adrenaline—you boost its CPU, RAM, or storage. It’s straightforward, but you’ll eventually hit a hard limit. Plus, it creates a single point of failure.
Horizontal Scaling (Scaling Out): Instead of one giant server, you add more servers to the group. This approach is the cornerstone of modern, resilient applications because it’s flexible and avoids the all-your-eggs-in-one-basket problem.
For almost any modern application, horizontal scaling is the undisputed winner. It lets your system absorb massive traffic spikes without breaking a sweat and keeps things running even if a server goes down.
The real magic of horizontal scaling comes alive when you pair it with two other cloud superpowers: auto-scaling and load balancing. Together, they create a system that breathes with your traffic, expanding and contracting as needed. A well-designed cloud infrastructure is built around these tools to guarantee stability and efficiency.
Auto-scaling is what lets your application add or remove servers automatically based on rules you define, like CPU usage hitting a certain threshold. This means you have exactly the right amount of power for your busiest moments without paying for idle machines during lulls.
A load balancer acts as the traffic director for your fleet of servers. It sits at the front door, intelligently spreading incoming requests across all available machines. This prevents any single server from getting swamped, which dramatically improves responsiveness. It also delivers high availability—if one server fails, the load balancer just sends traffic to the healthy ones.
An effective scaling strategy is proactive, not reactive. By configuring auto-scaling, you build an architecture that anticipates and adapts to demand, ensuring a consistently smooth user experience without manual intervention.
This focus on proactive performance management is reshaping the market. The global Application Performance Management (APM) market, valued at USD 12.27 billion in 2025, is on track to hit USD 46.89 billion by 2030. This explosive growth shows just how vital a solid performance strategy is for any modern business. You can find more details about this explosive market growth on mordorintelligence.com.

When you first dive into optimizing an application, the same questions tend to surface over and over. It can feel like a complex puzzle, but getting clear, straightforward answers is the key to making confident decisions and dodging common pitfalls.
Let's cut through the noise and tackle some of the most frequent queries we hear from engineers in the field.
This is the big one, and the answer is surprisingly simple: start with monitoring. You can't fix what you can't see. Before you even think about touching a line of code, you need to establish a solid performance baseline.
Get an Application Performance Management (APM) tool installed and start gathering real data on your key metrics:
This data-driven approach takes the guesswork out of the equation. It will immediately shine a light on the actual problem areas, letting you focus your energy where it will have the greatest impact.
The most effective optimization efforts are surgical. They target the specific, high-frequency "hot paths" in your code that your monitoring data has proven are both slow and heavily used by customers. Fixing these yields far greater results than perfecting a rarely used feature.
Choosing between vertical and horizontal scaling really boils down to your application's architecture and where you see it going in the long run.
Vertical scaling—just adding more power (CPU, RAM) to a single server—is the simpler route to take initially. The problem? You eventually hit a physical ceiling, and it creates a single point of failure. If that one beefed-up server goes down, your entire application goes with it.
On the other hand, horizontal scaling—adding more servers to your pool—is the modern standard for cloud applications. It’s just far more resilient and scalable. For a deeper look at boosting web responsiveness, you can find detailed guidance on how to improve website loading speed. If your app is stateless and can run on multiple instances behind a load balancer, horizontal scaling is almost always the superior long-term play.
Caching is incredibly powerful, but it's not a silver bullet. Think of it as a specialized tool in your belt, not a one-size-fits-all fix.
It truly shines when you're dealing with data that is frequently accessed but rarely changes. But if you try to apply it to highly dynamic or user-specific data, you can introduce a world of complexity and leave users frustrated with stale information.
Always analyze your data access patterns first. Caching is brilliant for fixing slow data retrieval, but it won't solve fundamentally inefficient business logic buried in your code. It solves a very specific kind of bottleneck, so make sure you’re using it in the right spot.
At Cloudvara, we provide the scalable, high-performance cloud infrastructure your applications need to thrive. Eliminate on-premise server headaches and focus on what you do best. Explore our secure and reliable cloud hosting solutions at https://cloudvara.com.