
In today's competitive landscape, application performance is not just a technical metric; it's a critical business driver. Users expect seamless, fast, and reliable experiences, and any deviation directly impacts revenue and reputation. For organizations leveraging complex cloud environments, the distributed nature of modern systems makes achieving this level of performance more challenging than ever. This is where a robust strategy rooted in application performance monitoring best practices becomes essential.
Moving beyond basic health checks, modern APM offers a comprehensive, data-driven approach to understanding how your applications behave in real-time. Implementing these proven strategies allows teams to proactively identify bottlenecks, accelerate troubleshooting, and continuously optimize the user experience. Many of these practices are foundational to a successful DevOps automation culture, enabling faster, more reliable software delivery.
This guide rounds up the 10 most impactful best practices that will transform your monitoring from a reactive chore into a proactive engine for growth and stability. We'll explore actionable techniques, from tracing user requests across dozens of services to setting meaningful performance objectives that align with business goals. By the end, you will have a clear roadmap to ensure your cloud applications deliver the consistent excellence your users demand.
In modern cloud environments, applications are rarely monolithic. Instead, they consist of numerous interconnected microservices. When a user makes a request, it can travel through dozens of services before a response is generated. This complexity makes pinpointing performance issues a significant challenge. Distributed tracing is a crucial application performance monitoring best practice that solves this by providing end-to-end visibility into the entire request lifecycle.
By instrumenting your code, distributed tracing captures the complete journey of a request as it moves across services, databases, and other components. Each step is recorded as a "span," and all spans for a single request are compiled into a "trace." This allows you to visualize the entire workflow, identify latency bottlenecks, and understand service dependencies. For instance, Uber uses Jaeger to trace requests across its vast microservices architecture, enabling engineers to quickly diagnose and resolve performance degradation.
To effectively implement distributed tracing, consider these strategies:
While backend performance is critical, it's the user's actual experience that ultimately defines success. Synthetic monitoring can simulate user paths, but it cannot capture the variability of real-world conditions. Real User Monitoring (RUM) is an essential application performance monitoring best practice that closes this gap by collecting performance data directly from the browsers of actual end-users as they interact with your application. This provides invaluable insights into how your application performs across countless devices, networks, browsers, and geographic locations.
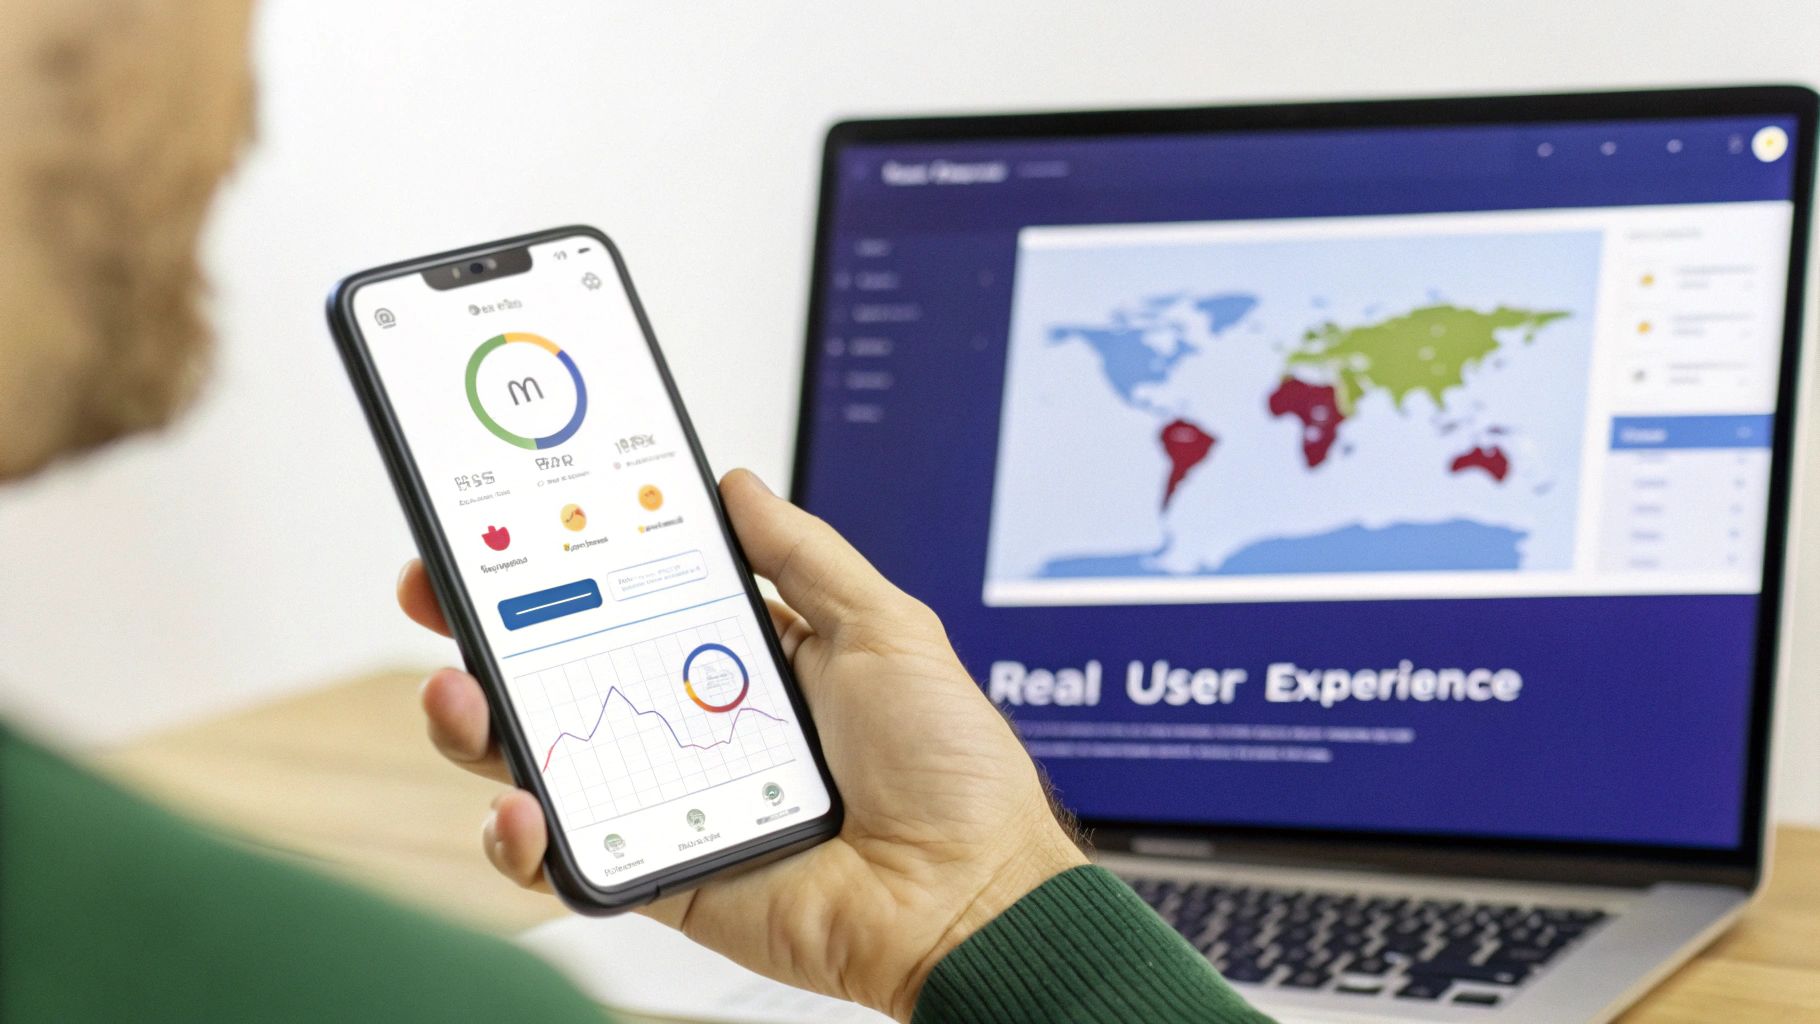
RUM helps you understand and optimize the digital experience by measuring metrics that matter to the user, such as page load times, interactivity delays, and Core Web Vitals. For example, an e-commerce platform can use RUM to track the performance of its checkout process across different regions, identifying and fixing latency issues that cause cart abandonment. Similarly, media companies use it to monitor video startup times and buffering rates, ensuring a smooth streaming experience for their global audience.
To effectively implement Real User Monitoring, consider these strategies:
While Real User Monitoring (RUM) tells you how actual users experience your application, synthetic monitoring proactively tests its availability and performance. It works by running automated scripts that simulate common user journeys and interactions from various geographic locations. This approach provides a consistent, reproducible performance baseline, allowing you to detect issues and performance degradations before your customers do, making it an essential application performance monitoring best practice.

This method is invaluable for establishing performance benchmarks and ensuring critical workflows are always functional. For example, a global payment processor might use synthetic tests to continuously monitor its checkout flow from dozens of locations, ensuring transactions are fast and reliable worldwide. Similarly, SaaS companies rely on it to constantly validate API endpoint availability and response times, which are crucial for their service level agreements (SLAs). After identifying performance bottlenecks, you'll need effective ways to address them; this article offers valuable insights into various strategies to improve website speed.
To get the most out of synthetic monitoring, focus on these implementation details:
To truly understand how your application behaves, you need more than just external checks; you need to see what's happening inside the code itself. Application Performance Monitoring (APM) instrumentation is the practice of embedding monitoring agents or libraries directly into your application's runtime environment. This provides deep, code-level visibility into performance, capturing detailed data like method execution times, database query performance, external API calls, and error rates without requiring manual code changes.
This approach transforms abstract performance problems into concrete, identifiable issues within your codebase. For example, a Java application using a Dynatrace agent can automatically trace a slow transaction back to a specific, inefficient SQL query. Similarly, a Node.js application instrumented with Datadog can reveal that an external API call is the root cause of high latency. This granular detail is essential for improving application performance and is a cornerstone of modern observability.
To effectively implement APM instrumentation, consider these strategies:
While metrics tell you that a problem exists and traces show you where it is, logs provide the crucial why. In a distributed architecture, logs are generated across countless services, making it nearly impossible to manually piece together the story of a single request. Log correlation and analysis solves this by centralizing logs and linking them with common identifiers, such as trace IDs or user IDs, providing a unified view of events across your entire system.
This practice is a cornerstone of modern application performance monitoring best practices because it connects disparate events into a coherent narrative for troubleshooting. For example, financial institutions use it to track a multi-step transaction from the initial API call through various payment gateways and back-end settlement systems. By correlating logs, they can instantly pinpoint where a failed payment went wrong. Powerful platforms like the ELK Stack or Splunk enable this by ingesting, parsing, and indexing logs for rapid, contextualized searching and analysis.
To effectively implement log correlation and analysis, consider these strategies:
user_id, request_id), making aggregation and filtering far more efficient than parsing plain text.While distributed tracing excels at showing the path of a single request, metric collection and aggregation provide the broad, quantitative overview needed to understand system health at scale. This application performance monitoring best practice involves gathering numerical data points like counters, gauges, and histograms from your applications and infrastructure at regular intervals. These metrics are then aggregated, stored, and visualized to reveal performance trends, capacity limits, and overall stability over time.
By systematically collecting metrics, you can move from reactive problem-solving to proactive health management. For example, AWS CloudWatch can monitor EC2 CPU utilization, allowing you to scale resources before performance degrades. Similarly, a web service tracking request rates and response times can immediately flag an unusual spike in latency. Tools like Prometheus and Grafana have popularized this approach, enabling engineering teams to build detailed dashboards that offer a real-time pulse of their entire environment.
To get the most out of your metric collection strategy, follow these key tips:
service.endpoint.http_requests_total). This makes metrics easy to find, understand, and aggregate across different services.While latency metrics tell you how fast your application is, error rates tell you how reliable it is. A low-latency application that constantly fails is useless to end-users. Error rate and exception tracking is an essential application performance monitoring best practice that focuses on capturing, grouping, and analyzing application errors in real time, providing immediate visibility into code-level problems. This goes beyond simple log files by aggregating similar exceptions and providing rich context.
Effective error tracking systems automatically capture stack traces, request parameters, affected user counts, and browser or OS versions. This allows development teams to understand the impact and priority of each issue. For instance, a mobile development team using a tool like Sentry can immediately see a spike in crashes affecting only the latest app version on a specific Android OS, enabling them to roll back the release or push a hotfix before it impacts their entire user base.
To effectively implement error rate and exception tracking, consider these strategies:
Monitoring application performance is only half the battle; the other half is responding to issues before they impact users. Effective alerting and anomaly detection form the foundation of a proactive performance management strategy. Instead of manually sifting through dashboards, this practice uses intelligent systems to automatically notify teams when key performance indicators deviate from expected norms, enabling rapid response and resolution.
Modern application performance monitoring best practices have moved beyond simple static thresholds. Advanced systems like Datadog or Dynatrace leverage machine learning to analyze historical data, identify seasonal patterns, and establish dynamic baselines. This allows them to detect subtle anomalies that static rules would miss, such as a gradual increase in API latency or an unusual drop in transaction volume on an e-commerce site. This approach significantly reduces false positives and combats alert fatigue, ensuring that engineers only receive notifications for legitimate, actionable issues.
To build a robust alerting framework, focus on these practical steps:
Without a clear definition of "good" performance, monitoring is just data collection. Establishing performance baselines is a fundamental application performance monitoring best practice that defines your system's expected behavior under normal conditions. This baseline becomes the yardstick against which you measure all future performance, allowing you to quickly spot deviations and anomalies. Building on this, Service Level Objectives (SLOs) and Service Level Indicators (SLIs) formalize these expectations into concrete, measurable goals.
SLIs are the actual measurements of performance, such as request latency or error rate. SLOs are the target values for those SLIs over a period, like "99.9% of API requests will be served in under 200ms." This framework moves the conversation from vague complaints about slowness to data-driven discussions. For example, GitHub publicly maintains a 99.95% availability SLO for its core services, providing clear user expectations and internal engineering targets. This approach helps teams prioritize work and make informed decisions about reliability versus new feature development.
To effectively set and manage performance goals, follow these strategies:
Application performance is not solely dependent on code; it is deeply tied to the health and capacity of the underlying infrastructure. Even the most optimized application will falter if it runs on over-stressed servers with insufficient CPU, memory, or disk space. Infrastructure and resource monitoring is a foundational application performance monitoring best practice that provides crucial visibility into the physical and virtual components supporting your software.
This practice involves tracking key metrics like CPU utilization, memory consumption, disk I/O, and network throughput across your servers, virtual machines, and containers. It helps you distinguish between application-level bugs and infrastructure-related constraints. For example, Netflix continuously monitors its vast infrastructure across multiple cloud regions to ensure seamless streaming, while financial institutions track database server performance to prevent transaction delays. This proactive monitoring ensures resource bottlenecks are identified and resolved before they impact the end-user experience.
To effectively implement infrastructure and resource monitoring, consider these strategies:
| Technology | Implementation complexity | Resource requirements | Expected outcomes | Ideal use cases | Key advantages |
|---|---|---|---|---|---|
| Distributed Tracing | High — requires widespread instrumentation and context propagation | High storage and processing; sampling needed to control volume | End-to-end request visibility, latency hotspots, service dependency graphs | Debugging microservices, root-cause analysis of cross-service latency | Precise request-path visibility and dependency mapping |
| Real User Monitoring (RUM) | Medium — client-side instrumentation and privacy controls | Moderate to high data volume; sampling and consent management | Real-world performance by device/browser/region; Core Web Vitals | Front-end UX optimization, geo-specific performance issues | Captures authentic user experience and device/network diversity |
| Synthetic Monitoring | Low–Medium — scripted tests and global test locations | Moderate compute for test runners; relatively low storage | Proactive availability checks and reproducible performance baselines | Uptime checks, critical transaction monitoring, SL verification | Detects regressions before users are affected; consistent baselines |
| APM Instrumentation | Medium — install agents or libs; minimal code changes usually | Agent overhead on hosts; language/runtime compatibility required | Code-level timings, DB call visibility, error diagnostics | Developer debugging, performance tuning of services | Deep, automatic code-level insights with framework integrations |
| Log Correlation and Analysis | Medium — centralized logging and standardized formats | High storage and indexing costs; retention planning required | Correlated request context, searchable traces, anomaly patterns | Incident investigations, audit/compliance, cross-service debugging | Rich contextual data for root-cause and pattern detection |
| Metric Collection and Aggregation | Low–Medium — exporters/agents and naming conventions | Efficient storage (TSDB), careful cardinality management | Time-series trends, capacity planning, alerting signals | Capacity planning, SLO tracking, operational dashboards | Lightweight long-term trends and fast query performance |
| Error Rate and Exception Tracking | Low — SDKs/agents capture exceptions automatically | Moderate storage for grouped events; privacy considerations | Aggregated errors, stack traces, user impact metrics | Crash/error triage, prioritizing fixes, release monitoring | Rapid identification and grouping of production errors |
| Alerting and Anomaly Detection | Medium — rule and ML model configuration; tuning required | Requires historical data and compute for models | Timely notifications, reduced false positives, incident initiation | On-call monitoring, anomaly detection across metrics/logs | Automates detection and routes actionable alerts to teams |
| Performance Baselines and SLOs/SLIs | Medium — requires metric definition and governance | Storage for historical metrics and dashboards | Objective SLO compliance, error budgets, trend-based decisions | Service reliability management, prioritizing engineering work | Aligns reliability with business goals and enables error budgeting |
| Infrastructure and Resource Monitoring | Low–Medium — agents/exports for hosts and containers | Continuous high-cardinality metrics; node-level telemetry | Resource bottleneck detection, scaling and capacity forecasts | Kubernetes/node monitoring, capacity planning, cost ops | Direct visibility into resource constraints and scaling needs |
Transitioning from a reactive to a proactive observability culture is the ultimate goal of implementing robust application performance monitoring best practices. Throughout this guide, we've navigated the essential pillars of a modern APM strategy, from the micro-level insights of distributed tracing and log correlation to the macro-level perspective provided by Real User Monitoring (RUM) and performance baselining. Each practice, whether it's setting precise Service Level Objectives (SLOs), implementing automated anomaly detection, or leveraging synthetic monitoring, contributes a unique and vital piece to the overall puzzle of system health and reliability.
By mastering these techniques, you're not just fixing bugs faster; you are fundamentally enhancing the user experience, protecting revenue streams, and fostering a culture of continuous improvement. The real power emerges when these practices are integrated, creating a comprehensive, multi-layered view of your application's behavior. An error spike tracked in your exception monitoring tool can be instantly correlated with a specific user journey from RUM, a detailed transaction trace, and an underlying infrastructure metric like CPU saturation. This holistic context is what separates best-in-class engineering teams from the rest.
The journey to mature observability is an iterative one. The key is to start small, build momentum, and consistently demonstrate value. Your immediate next steps should involve a strategic assessment of your current monitoring capabilities against the best practices we've discussed.
Ultimately, a world-class APM strategy is built upon an equally world-class infrastructure. The stability, scalability, and security of your underlying cloud environment directly impact every performance metric you track. Without a resilient foundation, your efforts to optimize application code and user experience will be compromised by infrastructure-level bottlenecks and downtime. This is where a managed cloud provider becomes an invaluable partner, handling the complexities of the underlying platform so your team can focus exclusively on application-level excellence.
Ready to build your high-performance applications on a rock-solid foundation? Cloudvara provides a fully managed, secure, and scalable cloud hosting environment designed to support the most demanding applications. Let us handle the infrastructure, so you can focus on implementing these advanced application performance monitoring best practices with confidence.