In today's competitive landscape, simply moving your business applications to the cloud isn't enough to guarantee success. The real advantage comes from using that powerful infrastructure to streamline operations and maximize productivity. But how do you know if your efforts are paying off? You measure them. This is where operational efficiency metrics become indispensable.
By tracking the right key performance indicators (KPIs), you can transform abstract goals like 'working smarter' into tangible, data-driven strategies. For businesses leveraging cloud hosting solutions that centralize critical software and provide a stable, accessible platform, these metrics offer a clear view into performance. They help highlight bottlenecks, reveal improvement opportunities, and ultimately drive profitability. For a comprehensive understanding of the foundational principles of measuring efficiency, delve into a practical guide on how to measure operational efficiency effectively.
This guide cuts through the noise to explore seven essential operational efficiency metrics, providing a comprehensive framework for optimizing your operations. We will cover actionable insights and practical implementation details for each, ensuring you get the maximum return on your technology investment. Let's dive into the KPIs that will empower your organization to work with greater precision and purpose.
Originally developed for manufacturing floors, Overall Equipment Effectiveness (OEE) has proven to be one of the most powerful operational efficiency metrics for any asset-heavy business, including those leveraging significant cloud infrastructure. OEE distills complex production data into a single, comprehensive score that reveals the percentage of time an asset is genuinely productive. It elegantly combines three critical factors: Availability, Performance, and Quality.
The final OEE score is calculated by multiplying these three percentages (Availability % x Performance % x Quality %). A score of 100% represents perfect production: manufacturing only good parts, as fast as possible, with no stop time. While a perfect score is theoretical, world-class companies like Toyota often achieve OEE levels of 85% or higher.
Implementing OEE starts with identifying the most critical constraints or bottleneck assets in your operation. Don't try to measure everything at once. Focus on a single production line or server cluster to build expertise and demonstrate value quickly.
Expert Tip: Begin with manual data collection on spreadsheets. This low-cost approach helps your team understand the underlying drivers of loss before you invest in expensive automated monitoring systems. It builds a foundational understanding of the "why" behind the numbers.
For example, Ford Motor Company uses real-time OEE dashboards to give line supervisors immediate visibility into production issues. This allows them to diagnose the root cause of a slowdown-whether it's a machine malfunction (Availability loss) or a process bottleneck (Performance loss)-and take corrective action instantly.
The following infographic breaks down the core components of OEE for quick reference.
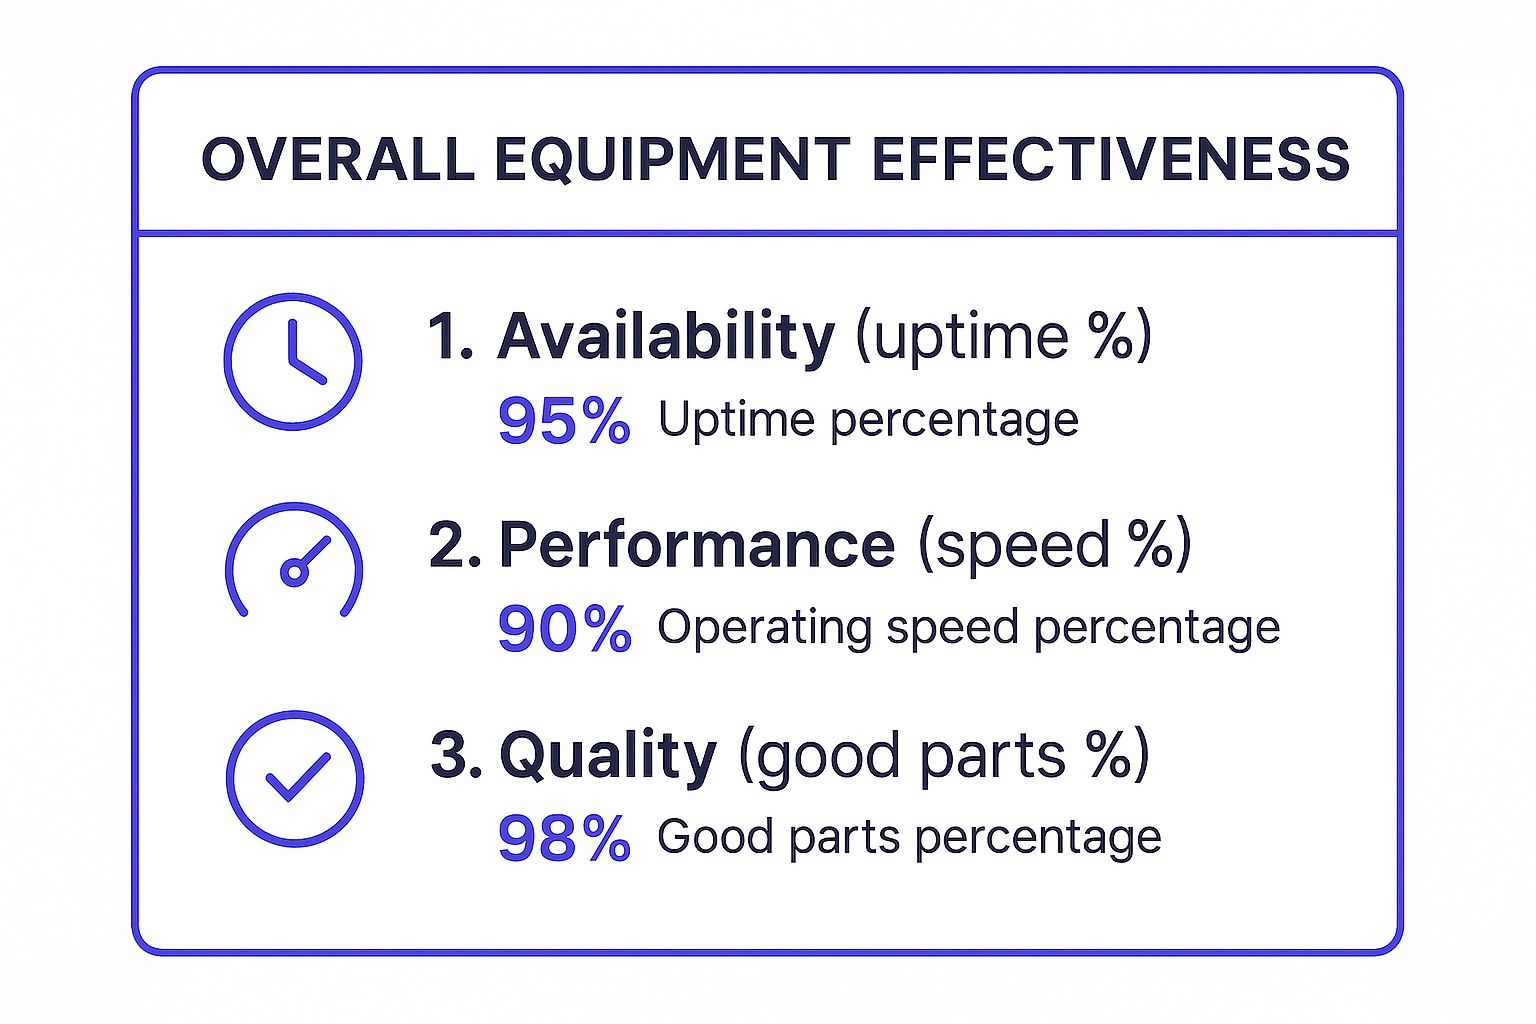
As visualized, each component targets a distinct type of operational loss, making OEE a powerful diagnostic tool rather than just a passive report card. By analyzing which of the three scores is lowest, you can pinpoint exactly where to focus your improvement efforts for the greatest impact.
Cycle Time is a fundamental operational efficiency metric that measures the total time required to complete one full cycle of a process, from its start to its finish. Popularized by pioneers like Taiichi Ohno of the Toyota Production System, it serves as a direct indicator of process speed and throughput capacity. For a law firm, this could be the time from client intake to case resolution, while for an accounting practice, it might be the time to complete a monthly bookkeeping cycle for a client.

It is one of the most critical operational efficiency metrics because it directly impacts customer satisfaction and operational cost. A shorter cycle time often means faster service delivery and lower labor costs per unit of work. It is calculated by measuring the elapsed time between the completion of two successive units or tasks.
Reducing cycle time is a core objective of Lean and Six Sigma methodologies. For example, Dell revolutionized PC manufacturing by reducing its build-to-order cycle time to under five days, a massive competitive advantage. Similarly, Amazon's relentless focus on shrinking its order fulfillment cycle time from days to hours, powered by warehouse automation and cloud-based logistics, has redefined e-commerce expectations.
The first step in leveraging Cycle Time is to clearly define the start and end points of the process you want to measure. Be precise. For an accounting firm, is the "tax return preparation" cycle complete when the preparer finishes, or only after the partner reviews and signs it? This clarity is essential for accurate measurement.
Expert Tip: Don't just track the average Cycle Time; also monitor its variation or standard deviation. A process with a low average but high variability is unpredictable and difficult to manage, often causing more client frustration than a slightly longer but highly consistent process.
Once defined, start tracking the time for each process instance. For a small business, this could begin with a simple shared spreadsheet where team members log start and end times. As you mature, you can implement automated tracking within your practice management or workflow software. The key is to analyze the collected data to find bottlenecks, which are the steps in the process that take the longest. Focusing your improvement efforts on these specific bottlenecks will yield the greatest reduction in the overall cycle time. By systematically addressing these constraints, you can enhance your firm's capacity without necessarily adding more staff. For more strategies on process optimization, explore these tips to improve workflow efficiency on cloudvara.com.
Popularized by quality management pioneers like W. Edwards Deming and embedded within Motorola's Six Sigma methodology, First Pass Yield (FPY) is a foundational operational efficiency metric for any process-driven organization. FPY measures the percentage of work that is completed correctly the first time, without needing any rework, repairs, or scrap. It serves as a direct and unvarnished indicator of process quality and resourcefulness.
The FPY calculation is straightforward: (Number of units completed correctly on the first pass) / (Total number of units entering the process). A high FPY score means your processes are stable, predictable, and efficient, requiring minimal intervention to produce a quality outcome. Companies like Intel, which maintain FPY above 99% in complex semiconductor manufacturing, demonstrate the power of this metric in achieving exceptional quality and cost control.
Implementing FPY begins with clearly defining what constitutes a "defect" at each critical stage of your workflow. This is not limited to manufacturing; for a law firm, a defect could be a contract with errors requiring revision. For an accounting firm, it could be a tax return with inaccuracies that must be corrected before filing.
Expert Tip: Don't just track the final FPY. Measure the yield at each individual step of the process. This creates a "Rolled Throughput Yield" (RTY) that provides a more accurate picture of end-to-end process health and pinpoints the exact stages where defects are most frequently introduced.
For instance, Johnson & Johnson rigorously tracks FPY in its pharmaceutical manufacturing lines. This isn't just about efficiency; it's a critical component of ensuring drug safety and regulatory compliance. A dip in FPY at a specific stage, like tablet coating or packaging, immediately triggers a root cause analysis to prevent defective products from ever reaching the market.
By focusing on FPY, you shift your team's mindset from simply fixing problems to preventing them from occurring in the first place. Analyzing the reasons behind a low FPY score-whether it's inadequate training, unclear instructions, or faulty equipment-allows you to make targeted improvements that have a compounding positive effect on overall operational performance.
Labor Productivity is a fundamental operational efficiency metric that measures the real output generated per unit of labor input. It quantifies how effectively a business transforms work hours into valuable goods or services, typically expressed as output per employee or output per hour. This metric is a cornerstone for assessing organizational health, comparing performance over time, and benchmarking against industry leaders.
The core principle, popularized by management thinkers like Frederick Taylor and Peter Drucker, is that systematically improving how work is done directly increases value creation. Higher labor productivity means a company can produce more with the same or fewer resources, leading to greater profitability and a stronger competitive advantage. This is one of the most direct operational efficiency metrics for service-based firms, including accounting, legal, and nonprofit organizations.
Start by defining a clear and consistent unit of output for a specific team or function. For an accounting firm, this could be "tax returns filed per accountant per month." For a law firm, it might be "billable hours per paralegal." Consistency is key to tracking trends accurately.
Expert Tip: Avoid the pitfall of focusing solely on quantity. Always pair labor productivity with a quality metric. For example, track "client cases resolved per agent" alongside "customer satisfaction scores (CSAT)" to ensure efficiency gains don't come at the expense of service quality.
For instance, UPS famously improved driver productivity by over 12% using its route optimization software (ORION) and vehicle telematics. By analyzing data to minimize left turns and reduce mileage, the company increased deliveries per driver without demanding they work harder, a prime example of augmenting human capability with technology. Similarly, many accounting firms now leverage cloud-based platforms to automate data entry, freeing up professionals to handle more high-value client advisory tasks and thus increasing their overall productivity.
By measuring and analyzing labor productivity, organizations can identify opportunities to improve business efficiency through better processes, targeted training, or strategic technology adoption. This allows managers to make data-driven decisions that enhance team performance and drive bottom-line growth.
The Asset Utilization Rate is a fundamental metric that measures how effectively an organization leverages its assets to generate revenue or value. This key performance indicator is one of the most direct operational efficiency metrics, assessing the proportion of time an asset is actively contributing versus its total potential capacity. It applies to everything from physical machinery and server racks to software licenses, revealing whether capital investments are delivering their expected return.
The rate is calculated by dividing actual usage by the maximum potential usage (Actual Output / Maximum Potential Output). A high utilization rate signifies efficient capital deployment, while a low rate points to idle, underperforming investments. For instance, Netflix famously re-architected its systems to achieve over 90% server utilization, drastically reducing waste in its massive cloud infrastructure through predictive auto-scaling.
Begin by cataloging your most significant capital assets, both physical and digital. For a small business, this might be a single delivery vehicle or its primary application server. For a law firm, it could be the utilization of its expensive legal research software subscriptions across all associates.
Expert Tip: Don't chase a 100% utilization rate at the expense of longevity. For physical equipment and digital infrastructure alike, scheduling downtime for preventive maintenance is crucial. Pushing assets to their absolute limit without breaks often leads to premature failure and more costly, unplanned outages.
Southwest Airlines provides a classic example, consistently maintaining over 11 flight hours per aircraft daily, well above the industry average of 8-9 hours. This high utilization is a cornerstone of their low-cost model, achieved through rapid airport turnarounds. Similarly, by closely monitoring the utilization of its cloud resources, a firm can avoid over-provisioning and significantly cut hosting costs. This level of monitoring requires robust data collection, a core tenet of effective database management. You can learn more about how to structure your data for better insights by exploring database management best practices on cloudvara.com.
Analyzing utilization patterns helps you identify peak demand periods and make data-driven decisions about future investments or divestments. It's a critical tool for ensuring every dollar invested in assets is working as hard as possible for your business.
While often associated with retail and manufacturing, Inventory Turnover is a critical operational efficiency metric for any business managing physical or even digital assets. It measures how many times a company sells and replaces its stock over a given period, revealing how efficiently it manages its capital tied up in inventory. A higher turnover rate generally indicates strong sales and effective inventory management, while a low rate can signal overstocking or poor sales performance.
The formula (COGS / Average Inventory) provides a powerful indicator of operational health. For instance, fast-fashion giant Zara achieves an impressive turnover of over 12 times per year by aligning production closely with real-time sales data. This contrasts with traditional retailers who might turn over inventory only 4-6 times, demonstrating the power of an optimized supply chain.
Start by calculating a baseline turnover ratio for your entire business. Then, segment the analysis by product category, location, or even individual SKU to identify which items are moving quickly and which are tying up capital. This granular view is essential for making targeted improvements.
Expert Tip: Avoid the trap of aiming for the highest possible turnover at all costs. An extremely high ratio might indicate under-stocking, leading to lost sales and poor customer satisfaction when popular items are unavailable. Balance is key.
For example, Walmart maintains a turnover rate of around 8-9 times annually through its legendary supply chain management, ensuring products are available without excessive overstock. Similarly, Amazon's strategy involves varying turnover targets by category, prioritizing fast delivery for high-demand items while accepting slower turnover for its long-tail marketplace offerings. You can improve your inventory management with dedicated software. Learn more about how Fishbowl hosting can offer a solution for your business inventory management.
Analyzing this metric helps you pinpoint inefficiencies in your purchasing and sales cycle. A declining turnover rate could be an early warning sign of shifting market demand or internal process bottlenecks, allowing you to take corrective action before it significantly impacts your bottom line.
Customer Order Lead Time is one of the most vital customer-facing operational efficiency metrics, measuring the total elapsed time from the moment a customer places an order to when they receive the product or service. This end-to-end metric provides a holistic view of your entire fulfillment chain, encompassing order processing, production, and final delivery. A shorter lead time directly correlates with higher customer satisfaction and can be a powerful competitive differentiator.

Popularized by e-commerce giants and lean manufacturing pioneers, this metric reveals bottlenecks that frustrate customers and add unnecessary costs. It forces a business to analyze the efficiency of its internal handoffs, supplier relationships, and logistics. The core components of lead time include:
Calculating the total lead time (Order Processing + Production + Delivery) provides a clear benchmark for improvement. For instance, Amazon Prime revolutionized retail by shrinking lead times to mere hours or a single day, setting a new standard for customer expectations. Similarly, fast-fashion brand Zara maintains a remarkable 2-3 week lead time from initial design to products hitting store shelves.
Begin by mapping your entire order-to-delivery process. Visually charting each step, from the initial client request to the final confirmation of receipt, is crucial for identifying hidden delays and inefficiencies. This initial analysis should be segmented by product line or customer type, as high-value clients or complex orders may have different lead time profiles.
Expert Tip: Don't just measure the total time; measure the time for each distinct stage. You might discover that 80% of your lead time is spent waiting for a single manual approval or a slow data transfer between systems, which are often quick wins to address.
For accounting and law firms, this metric can be adapted to measure the time from client engagement to final deliverables. Automating document intake and leveraging cloud-based collaboration tools can drastically cut down processing time. Reliable systems are key; ensuring continuous access to client data is essential for maintaining short lead times and is a core component of effective cloud business continuity. Communicating realistic timelines and providing clients with regular status updates throughout the process builds trust and manages expectations, turning operational efficiency into a tangible customer service benefit.
| Metric | Implementation Complexity | Resource Requirements | Expected Outcomes | Ideal Use Cases | Key Advantages |
|---|---|---|---|---|---|
| Overall Equipment Effectiveness (OEE) | Moderate to High – requires robust data systems | High – data collection, monitoring tools | Holistic productivity measure; identifies key losses | Manufacturing lines, continuous improvement programs | Combines availability, performance, and quality; industry standard |
| Cycle Time | Low – time measurement straightforward | Low to Moderate – timing tools or simple tracking | Understand process speed; identify bottlenecks | Process optimization, throughput improvement | Easy to understand; impacts delivery and capacity planning |
| First Pass Yield (FPY) | Moderate – needs quality tracking systems | Moderate – quality control setup | Direct measure of process quality; reduces rework | Quality improvement, defect reduction initiatives | Measures quality at source; reduces waste and rework |
| Labor Productivity | Low to Moderate – output and labor data needed | Moderate – requires labor and output tracking | Efficiency of labor usage; impacts profitability | Workforce management, productivity benchmarking | Simple calculation; supports benchmarking and profitability |
| Asset Utilization Rate | Moderate – asset tracking and capacity data needed | Moderate – asset management systems | Measures asset usage effectiveness; ROI optimization | Equipment and facility management, capital investment decisions | Identifies underutilized assets; supports capacity planning |
| Inventory Turnover | Low to Moderate – needs cost and inventory data | Moderate – accounting and inventory systems | Efficiency of inventory management; cash flow impact | Retail, manufacturing, supply chain management | Improves cash flow; benchmarkable across industries |
| Customer Order Lead Time | Moderate – involves end-to-end tracking | Moderate – order, production, delivery tracking | Enhances customer satisfaction; delivery performance | Customer service and fulfillment, e-commerce | Directly impacts customer loyalty; drives process improvements |
Tracking the seven operational efficiency metrics we’ve explored provides far more than just a historical report card for your business. From the granular focus of Overall Equipment Effectiveness (OEE) and Cycle Time to the broader perspectives of Labor Productivity and Inventory Turnover, these KPIs create a comprehensive and actionable roadmap for continuous improvement and sustained growth. They are the diagnostic tools that allow you to move beyond guesswork and instinct, empowering you with the objective data needed to make strategic decisions.
The true power of these metrics is unlocked when you transition from passive measurement to active management. The data points you collect are not endpoints; they are starting points for crucial conversations. They help you challenge long-held assumptions about "the way things are done" and empower your teams to pinpoint waste, identify bottlenecks, and innovate with confidence.
Mastering these metrics means embedding them into the very fabric of your operational culture. Consider these next steps to transform your data into a competitive advantage:
Ultimately, the consistent tracking and analysis of operational efficiency metrics shift your organization’s mindset. Efficiency ceases to be a one-time project or a buzzword; it becomes a core cultural value that drives daily decisions. By integrating these KPIs into your regular reviews and strategic planning, you build sustainable momentum that not only enhances profitability but also creates a more resilient, agile, and competitive organization poised for long-term success. This commitment to measurement and improvement is the engine that will power your growth journey.
Ready to build your operational strategy on a rock-solid foundation? Cloudvara provides secure, reliable, and high-performance cloud hosting for your essential tax, accounting, and business applications, freeing you to focus on optimizing the processes that matter most. Discover how a seamless cloud environment can enhance your firm's efficiency by visiting Cloudvara today.