We’ve all felt it. That sinking feeling when an app grinds to a halt. It’s more than just a technical glitch—it's a business problem in disguise. Application performance issues are usually symptoms of deeper troubles lurking in your code, infrastructure, or databases. The only real solution is to shift from reactive fire-and-forget fixes to a proactive strategy that puts user experience and business continuity first.
Think of a sluggish app like a retail store with jammed doors and confused staff. Frustrated customers will simply walk away, and many will never come back. In today’s market, performance isn’t just a feature; it's a core expectation.
When your application lags, crashes, or becomes unresponsive, the fallout goes far beyond a single user’s momentary annoyance. It chips away at your bottom line, erodes hard-won customer trust, and tarnishes your brand's reputation. Every millisecond of delay carries a real, tangible business cost. These aren't isolated technical hiccups—they're critical business risks that demand immediate and strategic attention.

The link between application speed and revenue is crystal clear. Study after study confirms that even minor delays or downtime can torpedo user retention and sales. For instance, a one-second delay in page load time can slash customer satisfaction by 16%.
Even more telling? Nearly 70% of online shoppers admit that slow websites make them less likely to buy. For businesses, these disruptions translate into measurable losses. On average, companies worldwide lose 5% of their annual revenue due to poor software performance and outages.
A slow application is more than an inconvenience; it's a silent revenue killer. Each moment of lag chips away at user patience, pushing potential customers toward faster, more reliable competitors.
It's easy to see performance as a purely technical metric, but its consequences are felt directly in your business operations and financial results. Here’s a quick breakdown of how common issues translate into tangible costs.
| Performance Issue | Impact on User Experience | Direct Business Consequence |
|---|---|---|
| Slow Page Load Times | Frustration, impatience, and a high likelihood of abandonment. | Lost sales, lower conversion rates, and reduced ad revenue. |
| Application Crashes or Freezes | Complete disruption, loss of unsaved work, and eroded trust. | Increased customer support tickets and high churn rates. |
| Unresponsive UI Elements | Confusion and doubt about whether an action was successful. | Lower user engagement and reduced feature adoption. |
| Inconsistent Performance | Unpredictability, making the app feel unreliable and unstable. | Damage to brand reputation and loss of repeat business. |
As the table shows, what starts as a few extra milliseconds of latency can quickly escalate into significant financial and reputational damage.
Beyond the immediate financial hit, poor performance inflicts long-term damage on how people see your brand. A consistently slow or buggy application sends a clear message: you don’t care about the user’s time or experience.
This erosion of trust is incredibly difficult to repair. It leads to negative reviews and poor word-of-mouth, which are powerful deterrents for potential new customers. A smooth, responsive user experience, on the other hand, builds confidence and fosters loyalty, turning casual users into brand advocates. Ultimately, investing in performance is investing in your brand’s future.
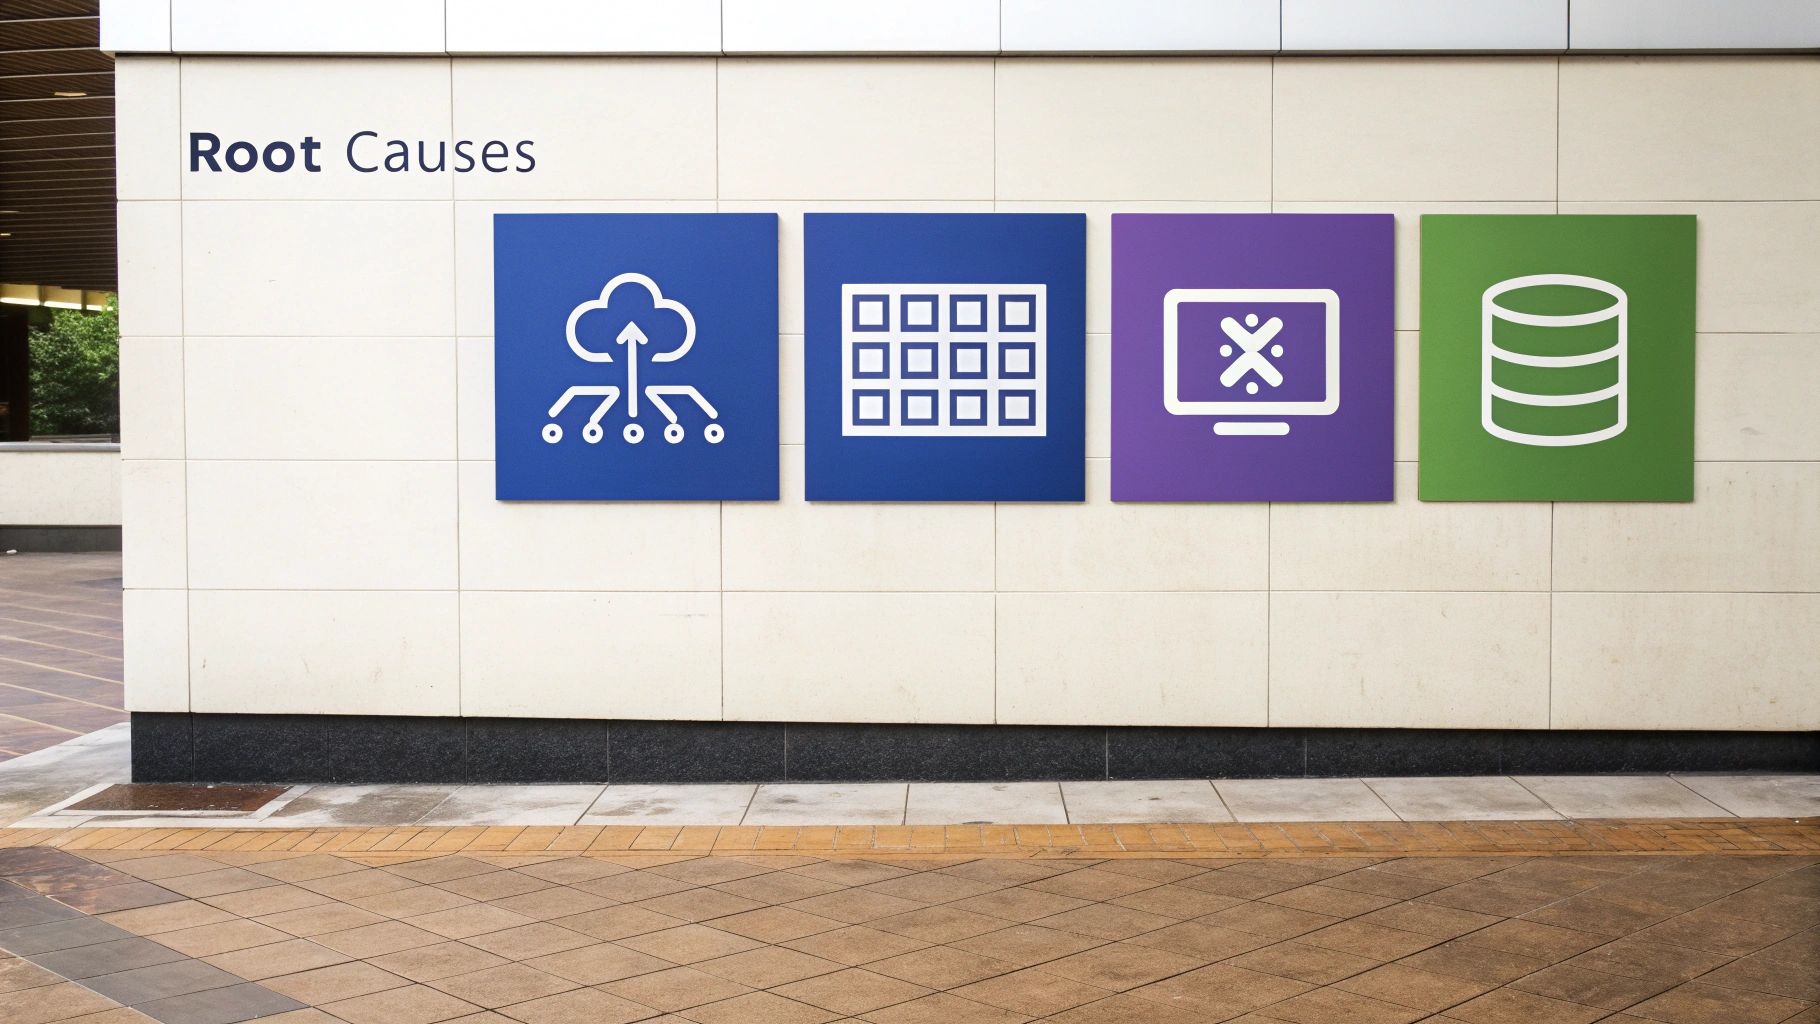
Chasing the symptoms of a slow application can feel like a frustrating game of whack-a-mole. You patch one issue, and another one immediately pops up somewhere else. The only way to truly fix performance problems for good is to look past the surface and dig down to the root cause.
When an application grinds to a halt, the problem almost always traces back to one of four areas: Code, Database, Network, and Infrastructure.
Think of these four as a high-performance pit crew. It doesn't matter how fast the engine is if the person changing the tires is slow. A single weak link can sabotage the entire operation, leaving your users staring at a loading screen and your business paying the price. By learning to spot the tell-tale signs of trouble in each area, you can diagnose problems with surgical precision.
At the very heart of your application is its code—the set of instructions that tells it what to do. When that code is clunky or inefficient, it’s like giving a world-class chef a terribly written recipe. No matter how skilled they are, the final dish will be slow to prepare and ultimately disappointing.
Inefficient code often shows up as excessive CPU usage, high memory consumption, or long delays for specific functions. These problems can stem from overly complex algorithms, redundant loops, or poor memory management that forces the system to work way harder than it needs to.
Common signs of code-level issues include:
If your application’s code is the chef, then the database is the pantry and librarian rolled into one. It stores and retrieves all the critical data needed to fulfill user requests. A slow database is like a librarian who takes an hour to find a single book, bringing the entire operation to a standstill.
Database performance issues are a classic source of slowdowns, especially for data-heavy applications. The problem could be poorly written queries that scan millions of unnecessary records, a lack of proper indexing that forces slow table scans, or contention for database locks that makes different processes wait in line. For a deeper dive, check out our guide on database management best practices.
A single unoptimized database query can create a massive ripple effect, slowing down dozens of dependent services and creating a poor experience for thousands of users. Identifying and fixing these queries often delivers the biggest bang for your buck in performance gains.
The network is the delivery system connecting your users, your application, and all its moving parts. Network latency acts like a perpetual traffic jam on this system, slowing down communication between services and delaying the final response to the user.
This is a huge deal in modern microservices architectures, where applications are made of many small, independent services that all talk to each other over the network. High latency, packet loss, or not enough bandwidth can create serious delays, even if the code and database are perfectly tuned. It’s like having a super-fast delivery truck that’s stuck on a congested highway—the truck’s speed doesn’t matter if the road is blocked.
Finally, every application runs on physical or virtual infrastructure—servers, storage, and other resources. Infrastructure limitations are like trying to host a massive music festival in a tiny backyard. No matter how well you plan the event, you simply don’t have the space or resources to handle the crowd.
Infrastructure bottlenecks happen when the underlying hardware can't keep up with what the application needs. This could mean an underpowered server with not enough CPU or RAM, slow disk I/O that can't read or write data fast enough, or misconfigured load balancers that send traffic unevenly. Right-sizing your infrastructure on a platform like Cloudvara is key to making sure you have all the power you need without overspending on resources you don’t.
Fixing performance issues after they’ve already hit your users is a losing game. The best strategy isn't about getting faster at firefighting; it's about building an early warning system that spots the smoke long before it turns into an inferno. This is exactly what Application Performance Monitoring (APM) is designed to do.
Think of an APM solution as your application’s central nervous system. It pulls in signals from every corner of your system—from the user's browser all the way down to the database—and translates that raw data into a clear, real-time picture of its health. Without it, you’re flying blind and waiting for customer complaints to tell you something’s broken.
The foundation of any good monitoring strategy is understanding what your users are actually experiencing. This is where Real User Monitoring (RUM) comes in. RUM tools capture performance data directly from the browsers and devices of people interacting with your application in the wild.
Instead of just knowing your server responds quickly, RUM tells you how long a user in another country, on a spotty mobile network, actually waited for a page to load. It answers the questions that server-side metrics alone can't:
This outside-in perspective is crucial. It connects technical metrics to real business outcomes, shifting the focus from "Is the server okay?" to the question that truly matters: "Are my users having a good experience?"
Modern applications are rarely a single block of code. They’re usually complex webs of interconnected microservices, databases, and third-party APIs. When a user performs a single action, like clicking "Add to Cart," that request might kick off a dozen different processes across your entire distributed system.
This is where Distributed Tracing becomes your superpower. Think of it like putting a tiny GPS tracker on every single user request. Distributed tracing follows that request on its entire journey, measuring exactly how long it spends in each service, database call, and network hop along the way.
If RUM shows you what the user experienced (a 5-second delay), distributed tracing shows you why it happened by pinpointing the exact service that took up 4.5 of those seconds.
This level of detail is a game-changer for diagnosing tricky application performance issues in a microservices environment. It turns a vague problem like "checkout is slow" into a specific, actionable insight like "the inventory service is timing out when calling the promotions API." For a complete overview, explore these application performance monitoring best practices to build a robust framework.
This demand for deep, actionable insights is fueling huge growth in the monitoring space. As applications grow more complex and move to the cloud, the need for real-time visibility has become critical. The global APM market was valued at around USD 12.27 billion in 2025 and is projected to skyrocket to USD 46.89 billion by 2030—a compound annual growth rate of about 30.76%. This growth isn't just a trend; it shows how essential monitoring has become for enhancing user experience and optimizing resources. You can find more insights on the APM market growth on Mordor Intelligence.
Ultimately, a modern APM strategy isn't about collecting mountains of disconnected data points. It's about creating a single, unified view that combines infrastructure health, application traces, and real user experiences. By integrating these different lenses, you create a powerful early warning system. This system lets your team shift from being reactive problem-solvers to proactive performance engineers, ensuring your application stays fast, reliable, and delightful for every single user.
Pinpointing the root causes of application performance issues is a huge win, but knowing why your app is slow doesn't actually fix it. Now it’s time to switch from diagnosis to action. This section is your toolkit for targeted optimization, with strategies designed to squash the specific bottlenecks we've uncovered—inefficient code, sluggish databases, network lag, and shaky infrastructure.
Think of each tactic as a concrete step your team can take to sharpen responsiveness, kill frustrating delays, and build a more resilient application. When you match the right fix to the right problem, you’ll see real performance gains and deliver the smooth experience your users expect.
The infographic below shows how a complete Application Performance Monitoring strategy works, starting from high-level management and drilling down into detailed tracing and health checks.
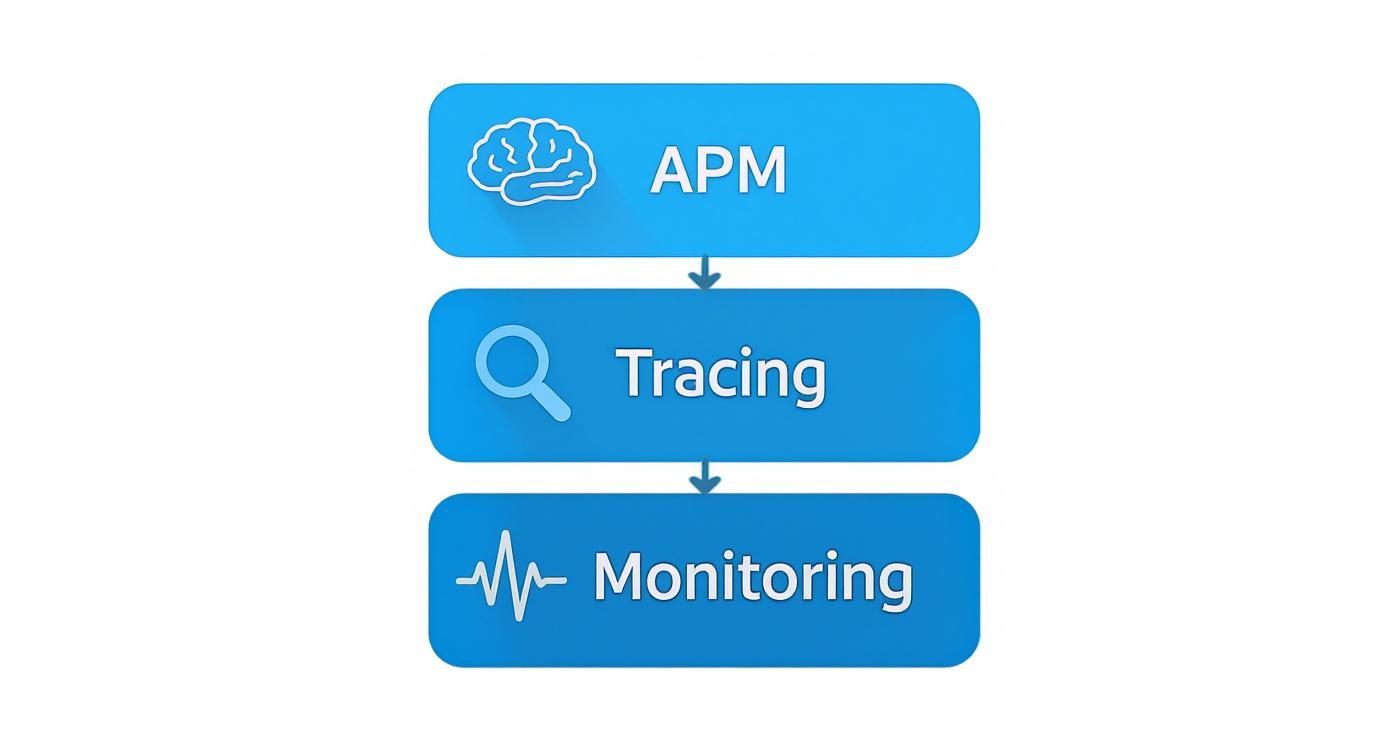
This visual drives home a key point: a solid APM strategy isn't just one thing. It’s a layered approach that combines broad monitoring with deep, specific tracing to uncover what’s really going on under the hood.
Inefficient code is often the most direct culprit behind poor performance. It forces your hardware to work overtime, chewing up CPU cycles and memory for no good reason. The trick is to find these hotspots and smooth them out.
Code Profiling: Use a code profiler to get a play-by-play breakdown of where your application is spending its time. Profilers act like a magnifying glass, showing you which specific methods or algorithms are the resource hogs. This data-driven approach takes the guesswork out of the equation and points your efforts where they’ll have the biggest impact.
Strategic Refactoring: Once you've found a bottleneck, it's time to refactor the code for efficiency. This doesn’t mean rewriting everything from scratch. Instead, it’s about making smart, targeted improvements, like simplifying a tangled algorithm, caching the results of an expensive operation, or using asynchronous processing so one slow task doesn't grind everything else to a halt.
Dependency Audits: Today’s applications lean on tons of third-party libraries and packages. It's smart to periodically audit these dependencies to make sure they’re up-to-date and not dragging down your performance. An old or poorly written library can easily become a hidden bottleneck.
A slow database can bring even the slickest application to its knees. Since almost every user action touches the database, even small improvements here can produce dramatic results across the board.
An application is only as fast as its slowest query. Even a small improvement in a frequently executed database query can reduce server load and improve response times across your entire platform.
Start with the queries your APM tool flags as the slowest or most frequent. From there, zero in on two key areas:
Query Optimization: Dive into the execution plans for your slow queries. Are they doing full table scans when an index would be faster? Are they joining massive tables in a clunky way? Rewriting a query to be more direct is often a high-impact fix that doesn't cost much to implement.
Proper Indexing: Think of indexes as the table of contents for your database—they help it find data without having to read every single row. Make sure columns that pop up a lot in WHERE clauses, JOIN conditions, and ORDER BY statements are properly indexed. Just be careful not to overdo it, as every new index adds a tiny bit of overhead to write operations.
Your code and database might be screaming fast, but if the network and infrastructure can't keep up, your users will still be stuck waiting. This is especially true if you have a global user base or a microservices architecture. For a rock-solid foundation, you might consider a specialized solution like cloud-based application hosting, which handles the infrastructure headaches for you.
To move beyond just identifying issues, a comprehensive approach to website performance optimization techniques is crucial for achieving truly peak performance.
Here are the key tactics for this layer:
Content Delivery Network (CDN): A CDN is a game-changer. It caches static files—like images, CSS, and JavaScript—on servers all over the world. When a user requests a file, it’s served from the server closest to them, which drastically cuts down on latency and makes your app feel much faster.
Intelligent Load Balancing: A load balancer is like a traffic cop for your servers, distributing incoming requests so no single server gets overwhelmed. Modern load balancers can use smart algorithms to route traffic based on server health, location, or current load, ensuring everything runs smoothly and stays online.
Auto-Scaling and Right-Sizing: Cloud platforms like Cloudvara let you set up auto-scaling rules that automatically add or remove server resources based on real-time demand. This means you can handle unexpected traffic spikes without breaking a sweat, and you won’t pay for idle resources when things are quiet. "Right-sizing" is the other side of that coin—using performance data to pick the perfect server type so you have the right mix of CPU, memory, and I/O for your specific workload.
Figuring out where to start can feel overwhelming. The table below breaks down the common bottlenecks we've discussed and maps them to the most effective strategies and tools available on the Cloudvara platform.
| Bottleneck Area | Common Problem Example | Primary Optimization Strategy | Cloudvara Tool/Feature |
|---|---|---|---|
| Code | A specific function takes 500ms to execute, slowing down every request. | Code Profiling & Refactoring | APM Tools & Staging Environments |
| Database | A query that joins three large tables without indexes is very slow. | Query Optimization & Indexing | Managed Database Services & Query Analytics |
| Network | Users in Asia experience long load times for images hosted in the US. | Content Delivery Network (CDN) | Integrated CDN Services |
| Infrastructure | The application crashes during a promotional traffic spike. | Auto-Scaling & Load Balancing | Auto-Scaling Groups & Managed Load Balancers |
This table serves as a quick cheat sheet. By connecting the symptom directly to a solution, you can prioritize your optimization efforts and get faster results. The goal is a systematic approach, not just random fixes.
Traditional application performance management often feels like a constant game of catch-up. An alert goes off, your team scrambles to figure out what broke, and you push out a fix, hoping the same problem doesn't pop up again next week. It's a reactive cycle.
But what if your systems could spot and head off application performance issues before they ever reached a user?
This is exactly where Artificial Intelligence for IT Operations, better known as AIOps, is making a huge difference. Instead of just reacting to failures, AI-powered platforms are shifting the entire approach from reactive firefighting to proactive, predictive management. It’s a fundamental move from just watching problems happen to getting ahead of them.
Think of an AIOps tool as an expert co-pilot for your application. It doesn’t just tell you when you’re hitting turbulence; it analyzes thousands of data points to predict weather patterns miles down the road, giving your team a chance to navigate around a slowdown before it becomes a full-blown outage.
Modern, distributed applications generate a staggering amount of data—far more than any human team could ever sift through manually. AI is perfectly suited to cut through all that noise and find the subtle but meaningful patterns that would otherwise fly under the radar.
This capability completely changes how teams manage complex systems. By 2025, the future of Application Performance Monitoring will be heavily defined by AI and automation solving these age-old challenges. In fact, the APM market is expected to grow from USD 8.9 billion in 2025 to USD 22.5 billion by 2034, all driven by this shift away from reactive fixes toward AI-driven, predictive insights. To get a deeper look at this trend, you can explore the APM market forecast and its drivers on MarketResearch.com.
AI doesn't just dump raw data on your dashboard; it offers context and clear, actionable answers. It does this by combining machine learning with huge datasets to unlock capabilities that were once out of reach for most operations teams.
Here’s what that looks like in the real world:
AIOps transforms application monitoring from a rearview mirror showing you what just went wrong into a forward-looking GPS that helps you navigate around future problems. This shift is essential for keeping applications running smoothly in today’s dynamic cloud environments.
Ultimately, bringing AI into performance management lets teams stop chasing symptoms and start fixing root causes with intelligence and foresight. This proactive approach is the key to building more resilient, reliable, and high-performing applications.
Even the best monitoring tools are just tools. They’re only as effective as the teams using them. To make lasting improvements to your application's performance, you need more than just a new software subscription—you need a cultural shift. The goal is to move from a reactive model, where performance is an afterthought, to a proactive one where it’s a shared responsibility across the entire company.
This means tearing down the traditional walls between development, operations, and even the business teams. Performance can't be "someone else's problem" anymore. When developers, ops engineers, and product managers all feel accountable for the user experience, the whole dynamic changes. This collaborative spirit is the very heart of movements like DevOps and Site Reliability Engineering (SRE).
Creating this kind of culture starts with making performance metrics visible and easy for everyone to understand. When a product manager can see how a new feature impacts page load times, they're equipped to make smarter decisions. When a developer sees the real-time effect their code has on server CPU, they’re empowered to write more efficient software from the get-go.
Here are a few key steps to building this shared mindset:
A performance-first culture treats speed and reliability as features, not as chores. It embeds accountability into every stage of the software lifecycle, from initial design to final deployment and beyond.
This cultural change completely transforms how teams work. Instead of just waiting for an alert to tell them something’s wrong, teams start actively looking for ways to optimize. They begin asking critical questions much earlier in the process, like, "How will this change affect our database load?" or "What's the latency impact of this new third-party API?"
This ongoing commitment to excellence is about combining the right tools with the right culture. It also means choosing the right partners and technologies that support this collaborative vision. For more on this, check out our guide to IT vendor management best practices, which can help you align your external partners with your internal performance goals.
Ultimately, building a culture of ownership is the final—and most crucial—step in solving application performance issues for good.
When you're knee-deep in trying to figure out why an application is dragging its feet, questions are bound to come up. Let's tackle some of the most common ones to clear up the confusion and give you a solid path forward.
The absolute first step is always to measure before you manage. Guessing where the problem lies is a recipe for wasted hours and mounting frustration. Before you do anything else, you need to get a comprehensive Application Performance Monitoring (APM) tool in place to establish a clear performance baseline.
Trying to diagnose a slowdown without hard data is like trying to find a needle in a haystack—in the dark. An APM solution lights everything up, giving you the visibility you need into response times, error rates, and resource usage. This lets you make an informed diagnosis and zero in on the actual bottleneck.
This is a classic problem, and the best way to solve it is with distributed tracing. A trace acts like a detective, following a single user request from the moment it hits your system, through every service, database, and API call it makes along the way.
Here’s the giveaway: If you see big gaps of time between the calls to your services—those empty spaces in the trace view—that’s a huge red flag for network latency. But if the time is being eaten up inside a specific service or function, the culprit is almost certainly in your application code or a slow database query.
Yes, you can, and to a pretty significant degree. While a truly bizarre new bug will always need a human to investigate, many of the recurring, predictable application performance issues can be handled automatically. This is the whole idea behind AIOps (AI for IT Operations).
AI-driven platforms can create "self-healing" infrastructure that knows how to react to common problems on its own. Think of things like:
The goal here isn't to replace engineers. It's to let automation handle the known, repetitive problems instantly. This frees up your team to focus their brainpower on solving the deeper, more complex architectural challenges that truly move the needle.
At Cloudvara, our job is to give you a rock-solid, scalable hosting environment that eliminates infrastructure bottlenecks from the equation. With our managed cloud solutions and 24/7 support, you can stop worrying about your servers and get back to focusing on your code. See how we can help by exploring our services.